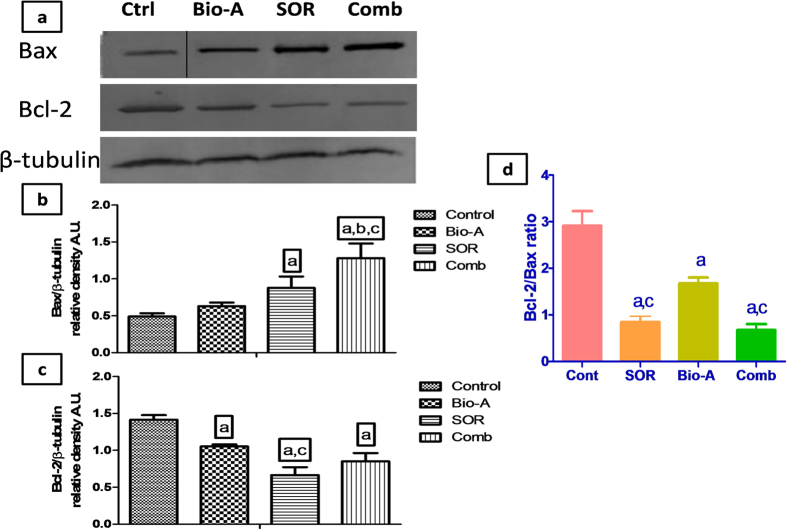
Figure 4. Effect of SOR/Bio-A combination on protein expression of Bax and Bcl-2 in HepG2 cells treated for 72 h.
(a) Representative western blots, the “Control” band in Bax protein blot was cropped and further represented by another full length replicate blot in Supplementary Figure 1. Bar chart showing: (b) Bax protein level, (c) Bcl-2 protein level in different groups, (d) Bcl-2/Bax ratio. (a) significantly different from control; (b) significantly different from SOR; (c) significantly different from Bio-A. (p < 0.05).

