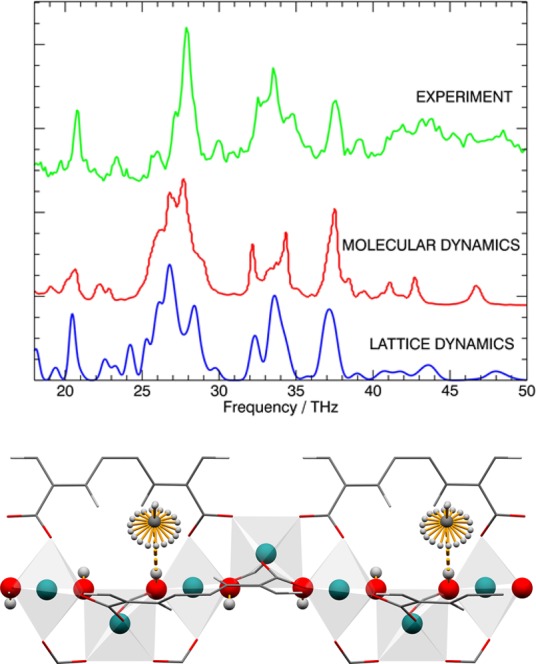
Figure 5.

Comparison of the INS spectra for measurements of MFM-300(In) at TOSCA, calculations by MD, and calculations by LD; (bottom) view of the structural model showing the almost free rotation of CH4I molecules at the bridging hydroxyl group (1 THz = 4.14 meV = 33.4 cm–1). Additional INS spectra are shown in the Supporting Information.
