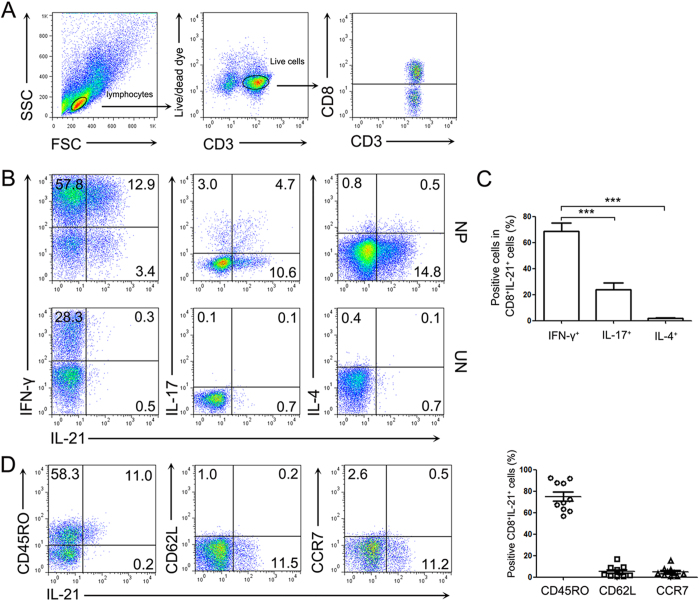
Figure 2. The characteristic of IL-21-expressing CD8+ T cells from polyp tissues.
Lymphocytes were analyzed with flow cytometry after stimulation with PMA/ionomycin and BFA for 5 h. (A) FACS gating was used in the CD8+ T cell analysis. (B,C) Representative FACS data and summary analysis show the IFN-γ, IL-17 and IL-4 co-expression with IL-21 by CD8+ T cells from polyp (n = 30) and control uncinate tissues (n = 19). (D) Representative FACS data and summary results show the CD45RO, CD62L and CCR7 expression in IL-21-expressing CD8+ T cells from polyp tissues (n = 30). The statistical significance was determined with the Mann–Whitney U test. ***P < 0.001. NP, nasal polyp; UN, uncinate.

