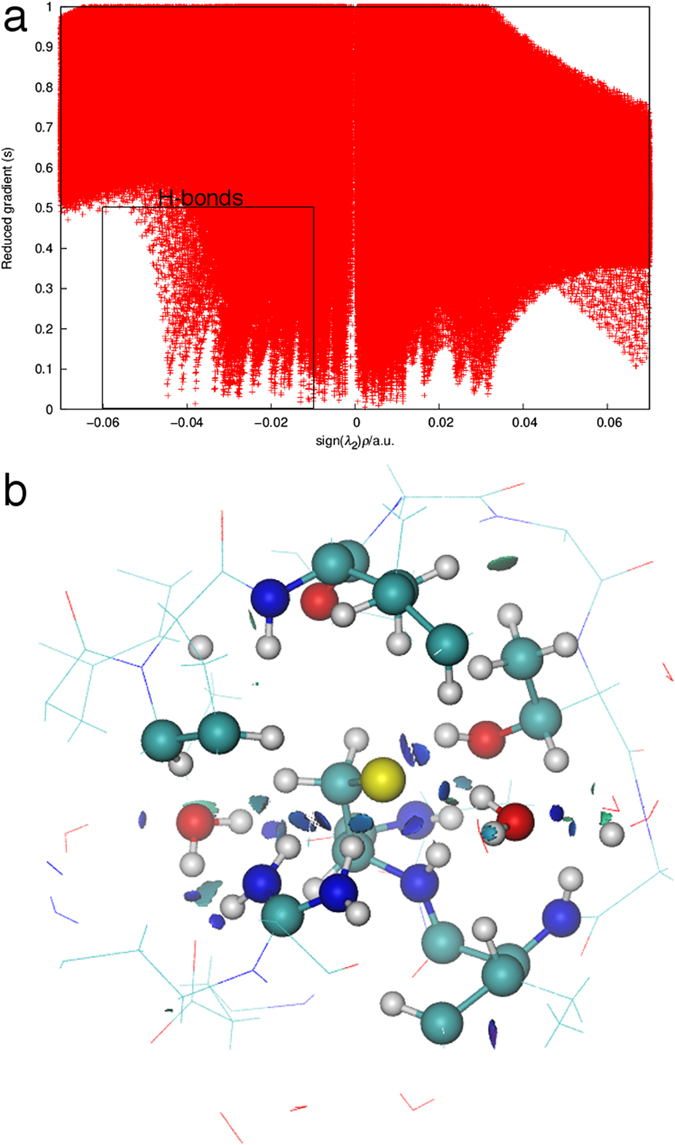
Figure 3. The output from the NCI analysis for the thiolate chain A structure showing the H-bond network.

(a) The bi-dimensional plot of the reduced density gradient s versus sign(λ2)ρ with the H-bond region indicated. (b) Gradient isosurfaces (s = 0.2 a.u) colored on a RGB scale according to the sign(λ2)ρ values over the range of −0.03 to 0.03 a.u.
