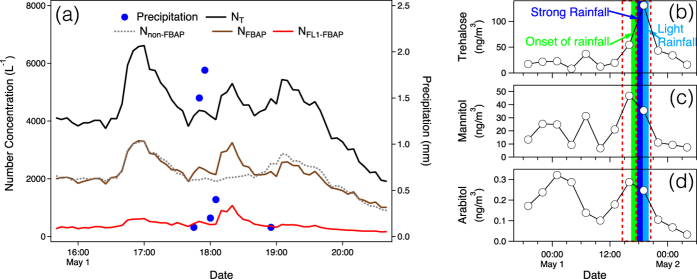
Figure 1. Temporal variations of aerosol number concentration (>0.8 μm, optically scattering diameter) observed by WIBS and rainfall rate and organic marker compounds.
(a) Variables presented are number concentration of total particles (NT), fluorescent biological aerosol particles (NFBAP), channel 1 fluorescent biological aerosol particles (NFL1-FBAP , protein-like aerosols) and non-fluorescent biological aerosol particles (Nnon-FBAP). Five-minute accumulated rainfall rate is shown by blue dots. Organic molecular markers, that is, (b) trehalose, (c) mannitol and (d) arabitol, are given along with the precipitation phases (colored shades, defined in Fig. 5). The red dotted boxes show the time periods of the offline samples.

