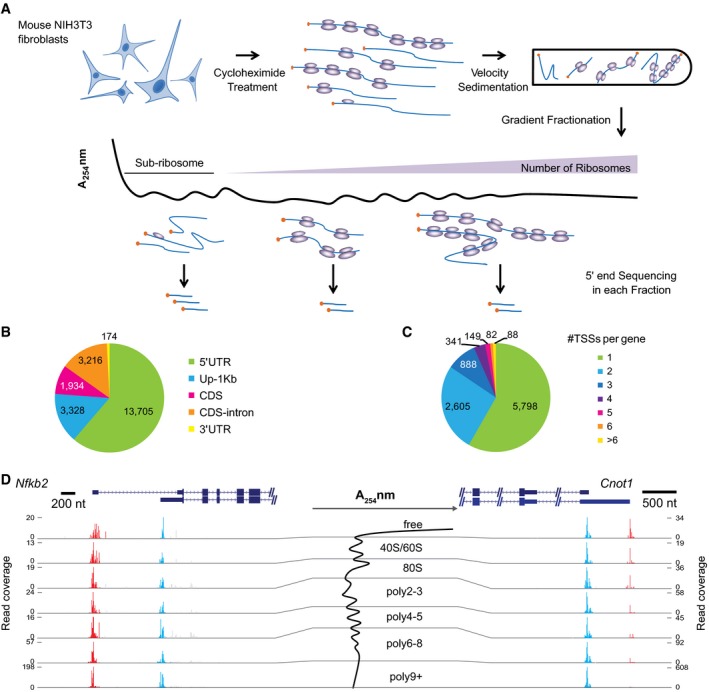
Figure 1. Experimental scheme, TSS discovery, and examples of isoform‐specific translational efficiency (TE).

- Experimental scheme. RNAs were collected from seven gradient fractions and the 5ʹ ends of RNA transcripts were quantitatively profiled in each fraction using an adapted cap‐trapping approach.
- Pie chart showing the distribution of TSSs identified in this study in different regions of protein‐coding genes. The majority of TSSs were derived from gross 5ʹUTRs, including annotated 5ʹUTRs and 1 kb upstream of the annotated TSSs (Up‐1 kb).
- Pie chart showing the number of TSSs in the gross 5ʹUTRs per protein‐coding gene. Out of the 9,951 genes with at least one TSS detected, 4,153 (41.7%) expressed multiple TSSs.
- Two examples were shown to demonstrate the impact of alternative TSSs on TE. Cumulative reads along each gene from the seven gradient fractions (shown in the middle) were plotted under the gene structure. While the two alternative TSSs from gene Nfkb2 resulted in no difference in TE, the two from gene Cnot1 led to substantial TE difference. Please note the range of read coverage varied across fractions. Red and blue bars represented sequencing reads mapped within distal and proximal TSSs, respectively; gray bars represented reads mapped outside of the identified TSSs. The description of the two genes can be found in Table EV3.
