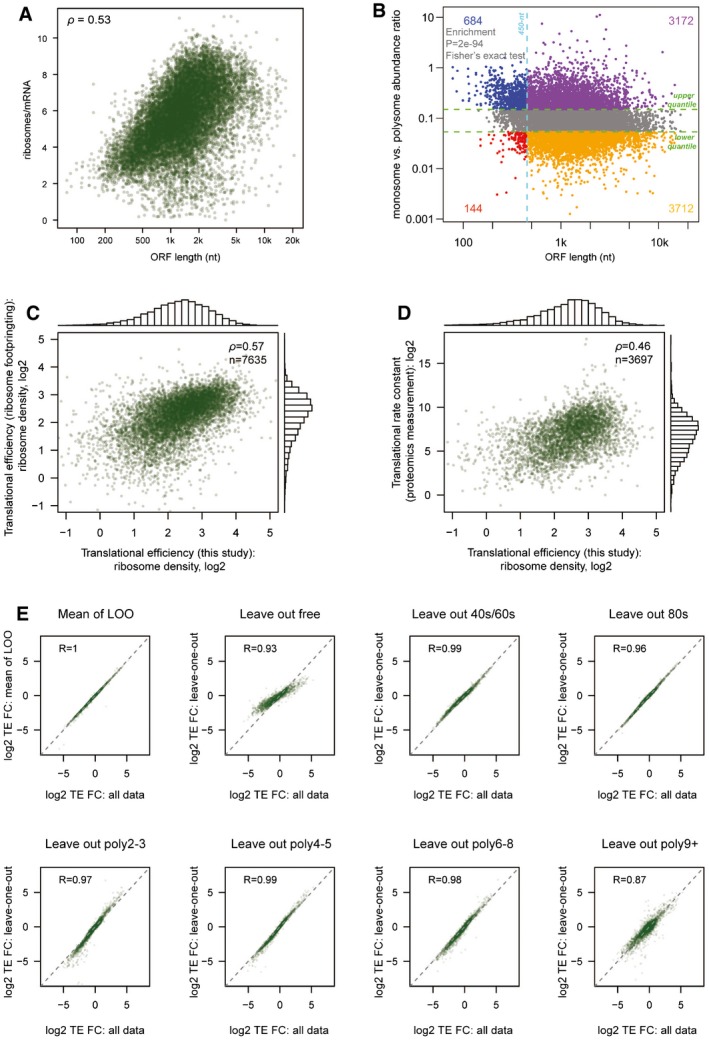
Figure EV2. Polysome profiling measured mRNA translational efficiency.

- For each TSS isoform, the number of ribosomes per mRNA was plotted against its corresponding ORF length.
- For each TSS isoform, the abundance ratio between monosome fraction and sum of polysome factions was plotted against its corresponding ORF length. Short ORFs (≤ 450 nt) were more enriched in the monosome fraction.
- TE values for each gene calculated based on published ribosome footprinting data were plotted against the TE values calculated based on polysome profiling data in this study.
- TE values for each gene calculated based on published proteomics/genomics data were plotted against the TE values calculated based on polysome profiling data in this study.
- Log2‐transformed TE fold change values for each pair of alternative TSS isoforms calculated based on all seven fraction data were compared to those calculated based on data with one of the seven fractions left out.
