
Figure EV3. GO enrichment analyses and the relationship between transcription and translation.
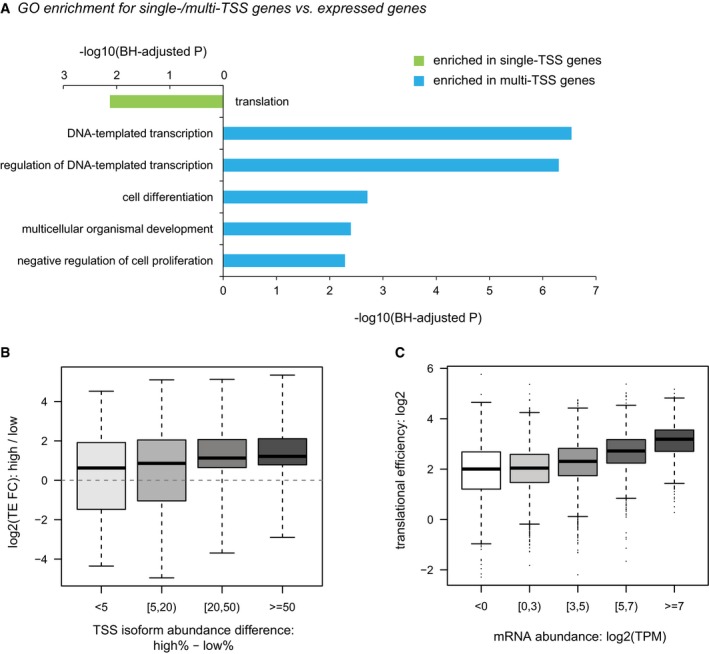
- GO enrichment for single/multi‐TSS genes over all expressed genes.
- Boxplots showing the distribution of TE divergence between alternative TSS isoforms grouped by their abundance differences. Box edges represent quantiles, whiskers represent extreme data points.
- Boxplots showing the distribution of TE at the gene level grouped by mRNA abundance. Box edges represent quantiles, whiskers represent extreme data points no more than 1.5 times the interquartile range.