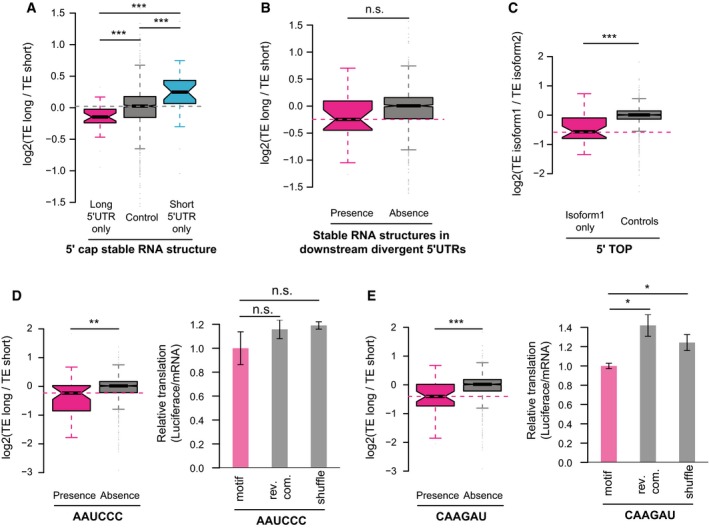
Figure 5. Roles of stable RNA structures, 5ʹ TOP sequences, and sequence motifs within 5ʹUTR for translational regulation.

- Boxplots comparing the log2 TE fold changes between three groups of alternative isoform pairs, the first group with 5ʹ cap‐adjacent (50 nt to 5ʹ ends) stable RNA secondary structures (MFE < −30 kcal/mol) present only in long 5ʹUTR isoforms, the second group with 5ʹ cap‐adjacent stable RNA structure present/absent in both isoforms, and the last group with 5ʹ cap‐adjacent stable RNA structure present only in short 5ʹUTR isoforms.
- Boxplots comparing the log2 TE fold changes between two groups of alternative isoform pairs, one group with stable RNA secondary structures (MFE < −35 kcal/mol in any 50‐nt RNA fragments) present in the downstream divergent 5ʹUTR and the other without.
- Boxplots comparing the log2 TE fold changes between TOP genes and non‐TOP genes (controls). For TOP genes, the TE fold changes were the ratios between the isoforms with 5ʹ TOP sequences present and isoforms without, and for non‐TOP genes, isoforms were randomly assigned as numerators and denominators.
-
Left: Boxplots comparing the log2 TE fold changes between two groups of alternative isoform pairs, one group with the motif AAUCCC present in divergent 5ʹUTRs and the other without.Right: Luciferase assay comparing the relative TE between reporter genes with five copies of motif AAUCCC, reverse complement of motif AAUCCC, and randomly shuffled sequences in their 5ʹUTRs (n = 3; mean ± SEM; n.s. P > 0.05).
- Similar to (D), but the motif is CAAGAU (n = 3; mean ± SEM; *P < 0.05; Student's t‐test).
