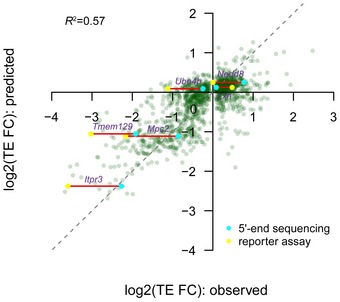
Figure EV7. Performance of the combinatory nonlinear regression model.

Same as Fig 6B, but in addition, we marked the six genes that were tested by luciferase reporter assay (Fig 2C) and containing unambiguously determined 5ʹUTR sequences (see Materials and Methods). The TE divergence values estimated based on 5ʹ end sequencing data are shown in cyan, and those based on reporter assay are shown in yellow.
