
Figure 1.
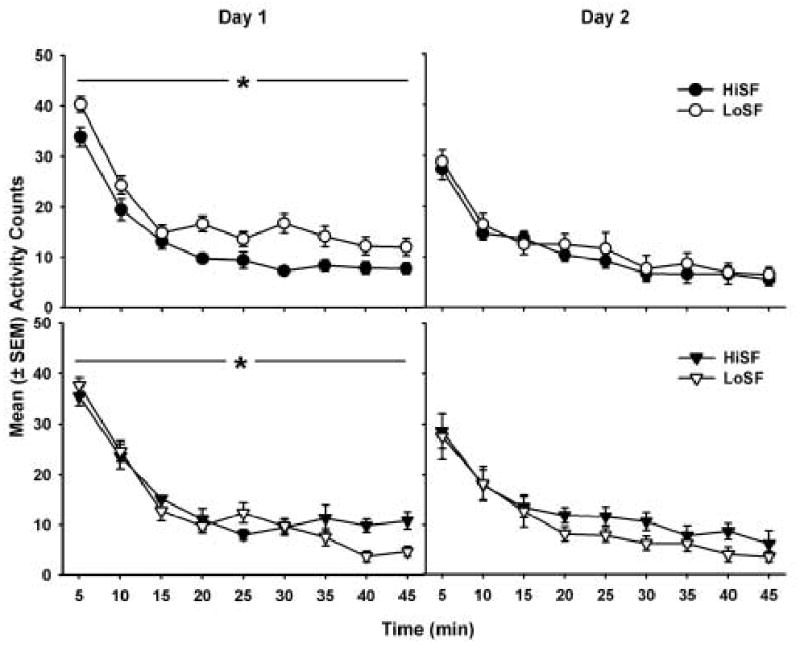
Day 1 (left panels) and Day 2 (right panels) locomotor counts (± SEM) in the HiS and LoS female (top panels) and male (bottom panels) groups over a 45-min period. Filled symbols refer to HiS and open symbols refer to LoS groups. Activity significantly decreased in an exponential pattern over the 45 min. Overall, LoS rats had significantly greater locomotor activity than HiS rats on Day 1 (* p < 0.05).