Fig. 1.

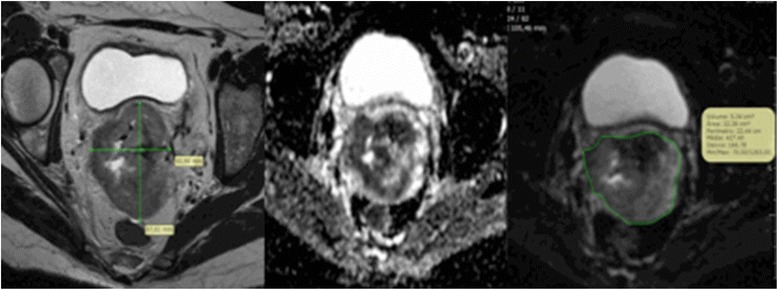
Magnetic resonance imaging examples of axial slices of: T2 weighted (left), diffusion weighted imaging (center), and region of interest drawn on an attenuation diffusion coefficient map (right)

Magnetic resonance imaging examples of axial slices of: T2 weighted (left), diffusion weighted imaging (center), and region of interest drawn on an attenuation diffusion coefficient map (right)