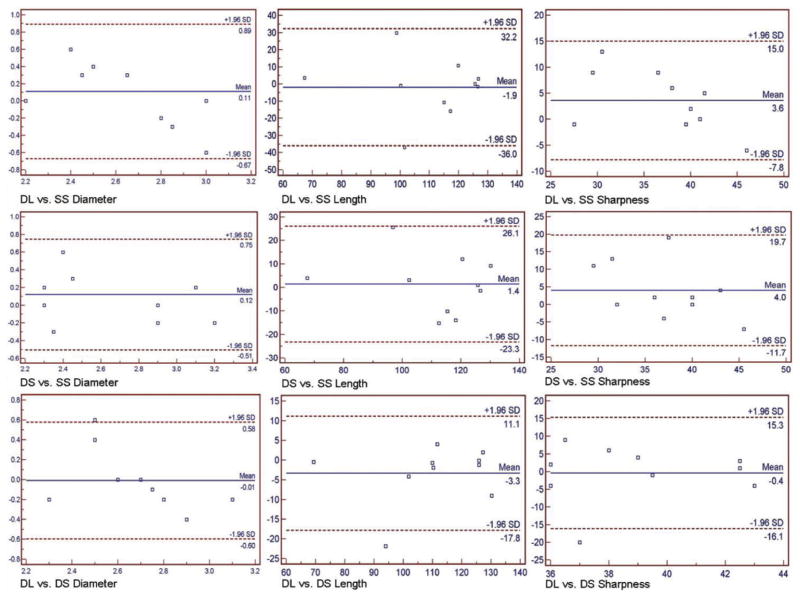
Figure 2.
Bland Altman analysis plots demonstrating agreement between the three different techniques when comparing vessel length (mm), diameter (mm), and sharpness (%). The Y axis is the difference between the techniques and X axis is their average. The blue line is the mean difference and red dotted line is 1.96 SD. DL = diastolic and long acquisition window; DS = diastolic and short acquisition window, SS = systolic and short acquisition window.

