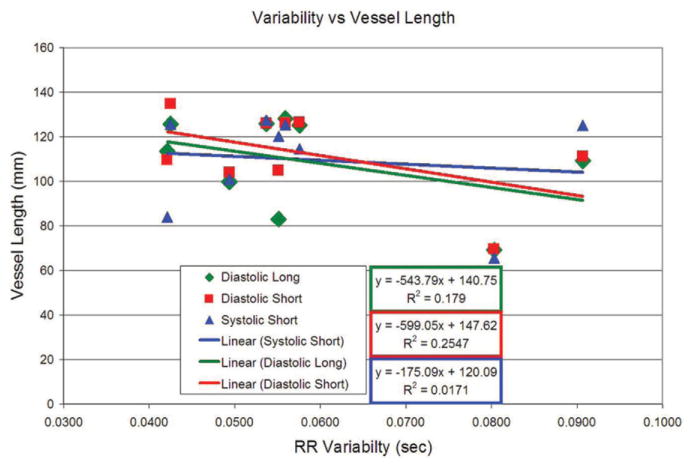
Figure 3.
Linear regression fits for vessel length compared to RR variability. There is an apparent trend for end-systolic short window (SS) acquisitions to be more robust in the face of RR interval variability than diastolic acquisitions. However, this trend is nonsignificant and probably results from outlying data points where the vessel length is shortest corresponding to 0.08-sec RR variability on the X-axis.

