
Figure 4.
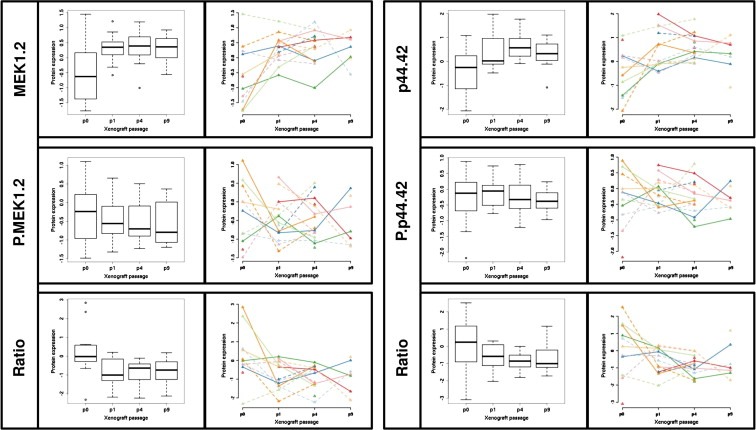
Determination by RPPA analyzes of the MEK1.2 and p44.42.MAP.kinase proteins and their respective phosphorylated form and ratio (phosphorylated protein/total protein). For each protein, patients (p0) and when available their corresponding xenograft at different passages (p1, p4 and p9) are represented. Protein expression is represented or by boxplots or by dots and lines per models. To distinguish models different colors and different line types were used.