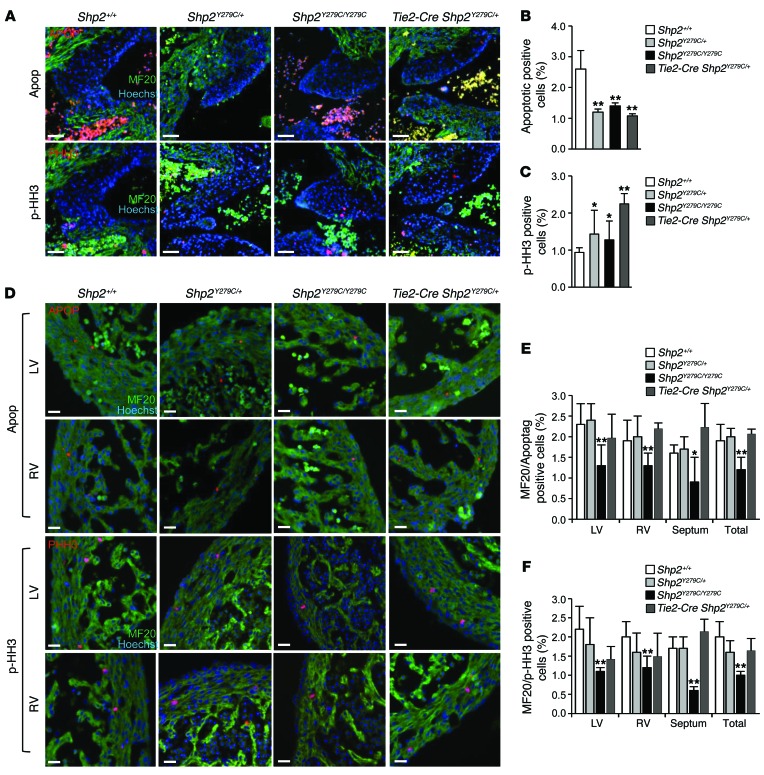
Figure 6. NSML expression affects both apoptosis and proliferation in the developing heart.
(A) Immunofluorescence staining of E14.5 embryo hearts representative of endocardial cell apoptosis and proliferation using Apoptag (top panels) to mark apoptotic cells (red) or p-HH3 (lower panels) to mark proliferation (red). Additional double-staining for MF20 was used to identify myocardium (green), and Hoechst stain was used to mark the nuclei, and in this case, to delineate the mitral valves. Scale bars: 50 μm. Quantification of endocardial (B) apoptosis and (C) proliferation is demonstrated from n = 4 embryos per group per analysis, with counts equal to or greater than 1000 cells/embryo/defined area. (D) Immunofluorescence staining of myocardial cell apoptosis and proliferation using Apoptag (upper panels) to mark apoptotic cells (red) or p-HH3 (lower panels) to mark proliferation (red) in left ventricle or right ventricle. Additional double-staining for MF20 was used to identify myocardium (green), and Hoechst stain was used to mark the nuclei. Scale bars: 50 μm. p-HH3, phospho-histone H3. Quantification of myocardial (E) apoptosis and (F) proliferation are demonstrated in left ventricle, right ventricle, septum, and total myocardium, with n = 4 embryos per group per analysis, with counts equal to or greater than 1000 cells/embryo/defined area. All data are expressed as mean ± SEM. *P < 0.05; **P < 0.01. P values were derived from 1-way ANOVA with Bonferroni’s post-test when ANOVA was significant.

