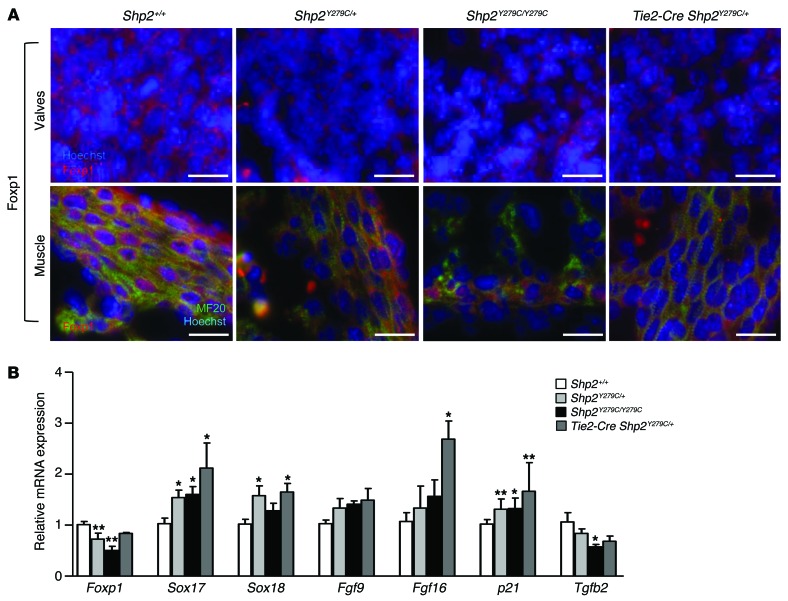
Figure 7. LOF mutations in PTPN11 lead to downregulation of FOXP1.
(A) Immunofluorescence staining of E14.5 embryo hearts representative of endocardial (upper panels) and myocardial expression (lower panels) of FOXP1 expression (red) at high magnification. Scale bars: 20 μm. Additional double-staining for MF20 was used to identify areas with myocardium (green, lower panels), and Hoechst stain was used to mark the nuclei (upper and lower panels) and to demarcate the valves (upper panels). (B) mRNA expression in embryo hearts at E14.5 quantified by qPCR showing a decrease in Foxp1 gene expression and signaling in NSML hearts as compared with control (Shp2+/+). n = 6 embryos per group. Data represent mean ± SEM. *P < 0.05; **P < 0.01. P values were derived from 1-way ANOVA with Bonferroni’s post-test when ANOVA was significant.

