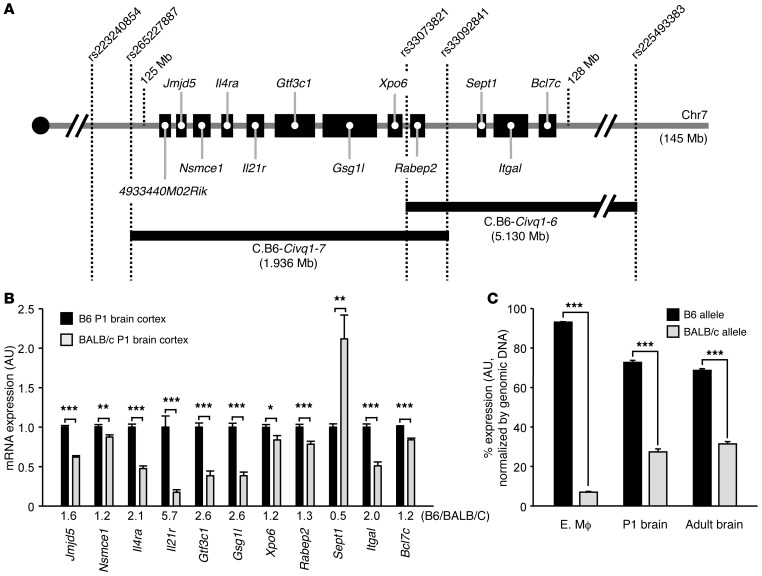
Figure 1. Candidate genes for Civq1 and Canq1 and their strain-specific transcript levels.
(A) Schematic showing 12 candidate genes mapping within the Civq1 and Canq1 loci. Two Civq1 congenic lines, C.B6–Civq1–6 and C.B6–Civq1–7, carry segments of B6 chromosome 7 introgressed into the BALB/c background. Together, these 2 congenic strains cover the entire candidate region of Civq1. (B) Transcript levels of each gene transcript in P1 brain cortex from B6 and BALB/c mice were determined by qRT-PCR. Gapdh was used for normalization. Values represent mean ± SEM from 7 B6 animals and 8 BALB/c animals. (C) The strain-specific mRNA expression level difference of the Il21r transcript. Graph represents allele-specific expression in tissues from F1 (B6-BALB/c) mice. A coding SNP (rs33008564) is used to monitor the allele-specific transcripts of Il21r in embryonic macrophage (MΦ) at E18.5, in P1 brain cortex, and in adult brain cortex. Genomic DNA was used for normalization. Values represent mean ± SEM from at least 3 animals per tissue (6 animals for embryonic macrophage, 5 animals for P1 brain cortex, and 3 animals for adult brain cortex). *P < 0.05; **P < 0.01; ***P < 0.001, 2-tailed Student’s t test.

