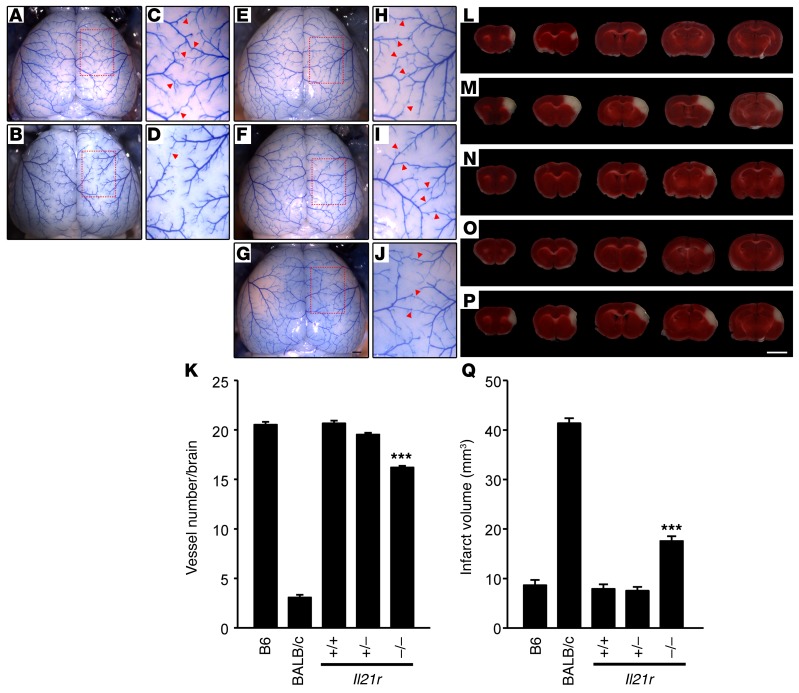
Figure 2. Collateral vessel anatomy and infarct volume after MCAO in Il21r knockout mice.
(A, B, and E–G) Representative images are shown for 2 inbred strains (B6, A; BALB/c, B) and Il21r knockout mouse strains, WT (E), heterozygous (F), and KO (G). Scale bar: 1 mm. (C, D, and H–J) Photographs in C, D, H, I, and J are 3 times magnified from A, B, and E–G, respectively, and red arrowheads indicate vessel connections between ACA and MCA. (K) Graph indicates the average number of collateral vessel connections in the brain. Total number of animals for B6, BALB/c, Il21r WT, Il21r Het, and Il21r KO are 33, 30, 40, 61, and 51, respectively. Values represent mean ± SEM. ***P < 0.001 vs. B6, BALB/c, Il21r WT, and Il21r Het, 2-tailed Student’s t test. (L–P) Serial brain sections (1 mm) from B6 (L), BALB/c (M), and each genotype of Il21r (WT, N; Het, O; KO, P) 24 hours after MCAO. Infarct appears as white tissue after TTC staining. Scale bar: 5 mm. (Q) Graph shows infarct volume for B6, BALB/c, Il21r WT (+/+), Il21r Het (+/–), and Il21r KO. Total number of animals are 32, 30, 30, 36, and 47, respectively. Values represent mean ± SEM. ***P < 0.001 vs. B6, BALB/c, Il21r WT, and Il21r Het, 2-tailed Student’s t test.

