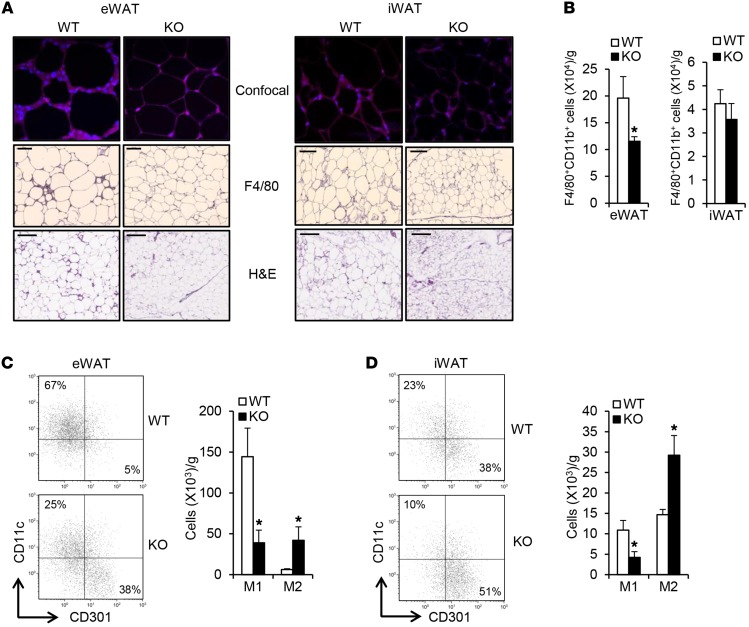
Figure 6. Irf3–/– mice exhibit reduced infiltration and altered polarization of macrophages in adipose.
Male WT and Irf3–/– mice were fed HFD for 16 weeks, n = 7–8 per genotype. (A) Histology of eWAT and iWAT from WT and Irf3–/– mice, including F4/80 immunostaining. Confocal images were taken at ×40 magnification. For F4/80 immunostaining, scale bars = 100 μm, and for H&E staining, scale bars = 200 μm. (B) Adipose tissue macrophage (F4/80+CD11b+ cells) content in SVF isolated from eWAT and iWAT of WT and Irf3–/– mice on HFD. (C and D) Distribution of M1 (CD11c+) and M2 (CD301+) macrophages in SVF from eWAT (C) and iWAT (D) of WT and Irf3–/– mice on HFD. Data are shown as absolute number normalized to fat pad weight. n = 5 per genotype. Data are presented as mean ± SEM. For all data, *P < 0.05.

