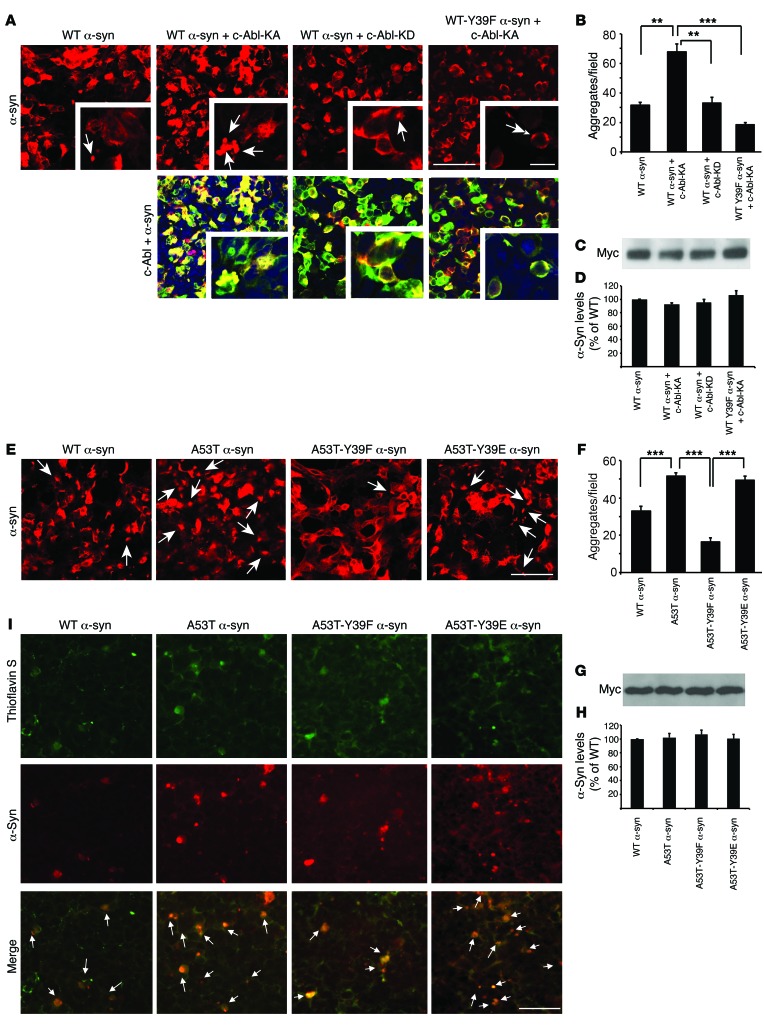
Figure 9. Phosphorylation of α-synuclein at tyrosine 39 triggers aggregation.
(A and E) Representative immunofluorescent images of myc-tagged α-syn (red) or GFP-tagged c-Abl and myc-tagged α-syn (merge) in HEK293T cells transfected with indicated plasmids. Single-headed arrows indicate aggregates. Double-headed arrow indicates area with no aggregation. Scale bars: 50 μm; 5 μm (inset). (B and F) Number of immunopositive aggregates per field was quantitated and compared with WT levels. (C and G) Immunoblots of cell lysates with antibodies against the myc epitope. (D and H) Quantifications of myc as percentage of WT levels. (I) Representative immunofluorescent images of thioflavin S staining in HEK293T cells overexpressing indicated myc-tagged α-syn. Single-headed arrows indicate colocalization of thioflavin S and α-syn. Scale bar: 25 μm. Data are from at least 3 independent experiments. (B, D, F, and H) Statistical significance was determined by 1-way ANOVA with Tukey’s post-test of multiple comparisons. Quantified data are expressed as the mean ± SEM. **P < 0.01, ***P < 0.001.

