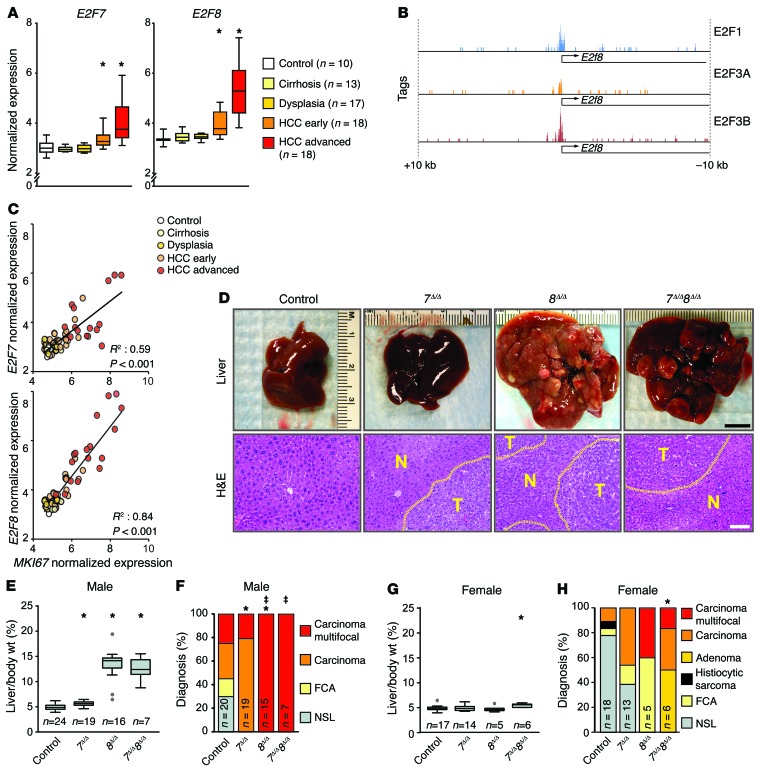
Figure 1. Loss of atypical E2Fs leads to carcinogen-induced HCC.
(A) Box plots showing the mRNA levels of E2F7 and E2F8 from patients with normal or diseased livers derived from Affymterix Microarrays, Wilcoxon tests with Bonferroni’s correction for multiple tests. *, vs. control: E2F7 HCC-early, P = 0.020; HCC-advanced, P < 0.001; E2F8 HCC-early, P = 0.001; and HCC-advanced, P < 0.001. (B) Promoter occupancy of E2Fs on the E2f8 promoter. E2F1, E2F3A, and E2F3B tags were identified by ChIP-seq conducted in MEFs overexpressing E2F1, E2F3A, or E2F3B. (C) Correlation between expression of E2F7/8 and MKI67 mRNA levels in the data set described in A. P values, linear regression analysis. (D) Representative pictures of livers (top) and H&E-stained liver sections (below) from DEN-treated 9-month-old 7fl/fl 8fl/fl (control), Alb-Cre 7fl/fl (7Δ/Δ), Alb-Cre 8fl/fl (8Δ/Δ), and Alb-Cre 7fl/fl 8fl/fl (7Δ/Δ 8Δ/Δ) male mice. Areas of HCC are outlined by dotted lines. T and N, tumor and normal liver, respectively. Scale bars: 1 cm (top) and 100 μm (bottom). (E) Box plots showing the ratio of liver vs. body weight (liver/body wt.) of 9-month-old DEN-treated male mice. Outliers are represented by gray dots. Wilcoxon tests with Bonferroni’s correction. *, vs. control: 7Δ/Δ, P = 0.009; 8Δ/Δ, P < 0.001; and 7Δ/Δ 8Δ/Δ, P < 0.001. (F) Histopathological analysis of livers from E. FCA, focal cellular atypia, NSL, no significant lesions. Fisher’s exact tests with Bonferroni’s correction. *, carcinoma (focal/multifocal) vs. control: 7Δ/Δ, P = 0.004; and 8Δ/Δ, P = 0.13. ‡, multifocal carcinoma vs. control: 8Δ/Δ, P < 0.001; and 7Δ/Δ 8Δ/Δ, P = 0.015. (G) Box plots showing liver/body wt. of 9-month-old DEN-treated female mice. Wilcoxon tests with Bonferroni’s correction. *, 7Δ/Δ 8Δ/Δ vs. control, P < 0.001. (H) Histopathological analysis of livers from G. Fisher’s exact tests with Bonferroni’s correction. *P = 0.026, carcinoma vs. control. n, number of mice or patients per group.

