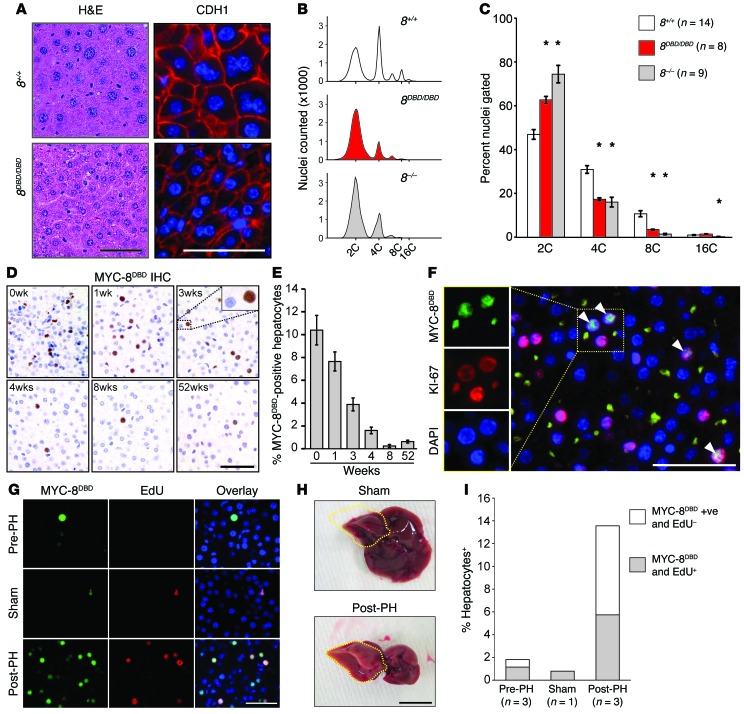
Figure 5. E2F8 DNA binding activity is essential for endoreduplication.
(A) Histology of livers from 12-month-old 8+/+ and 8DBD/DBD mice. H&E-stained sections (left), immunofluorescence (IF; right) for cadherin 1 (CDH1) (red) and DAPI (blue). Scale bars: 50 μm. (B) Representative fluorescence-activated cell sorting profiles of propidium iodide–stained liver nuclei from 4-month-old 8+/+, 8DBD/DBD, and 8–/– mice. (C) Nuclear liver ploidy of mice from B. Bars represent means ± SEM. Wilcoxon tests with Bonferroni’s correction for multiple tests. *, 8DBD/DBD and/or 8–/– vs. 8+/+. For 8DBD/DBD: 2C, P = 0.002; 4C, P < 0.001; and 8C, P < 0.001. For 8–/–: 2C, P < 0.001; 4C, P = 0.001; 8C, P < 0.001; and 16C, P = 0.002. (D) IHC using Myc epitope–specific antibodies that recognize the expression of 5×Myc-tagged 8DBD (MYC-8DBD) in livers of 8DBD/DBD mice at the indicated ages. Scale bar: 50 μm. (E) Quantification of MYC-8DBD expression in D. Average percentage of positive hepatocytes per ×40 field ± SEM for 2 livers for 0 to 8 weeks and 1 liver for 52 weeks. At least 640 hepatocytes were counted per liver. (F) IF for MYC-8DBD (green), KI-67 (red), and DAPI (blue) in livers of 3-week-old 8DBD/DBD mice. Colocalization of 8DBD and KI-67 (arrowheads). Scale bar: 50 μm. (G) IF for MYC-8DBD (green), EdU (red), and DAPI (blue) of liver sections from tissue removed during partial hepatectomy (Pre-PH), from sham surgery mice (Sham), or regenerating tissue 32 hours after partial hepatectomy (Post-PH). Scale bar: 50 μm. (H) Representative pictures of Sham- and Post-PH–treated livers. The right lobe (which was not excised) is outlined in yellow. Scale bar: 1 cm. (I) Quantification of MYC-8DBD–positive and EdU-positive hepatocytes from livers described in G. At least 100 hepatocytes were counted per liver. n, number of mice per group.

