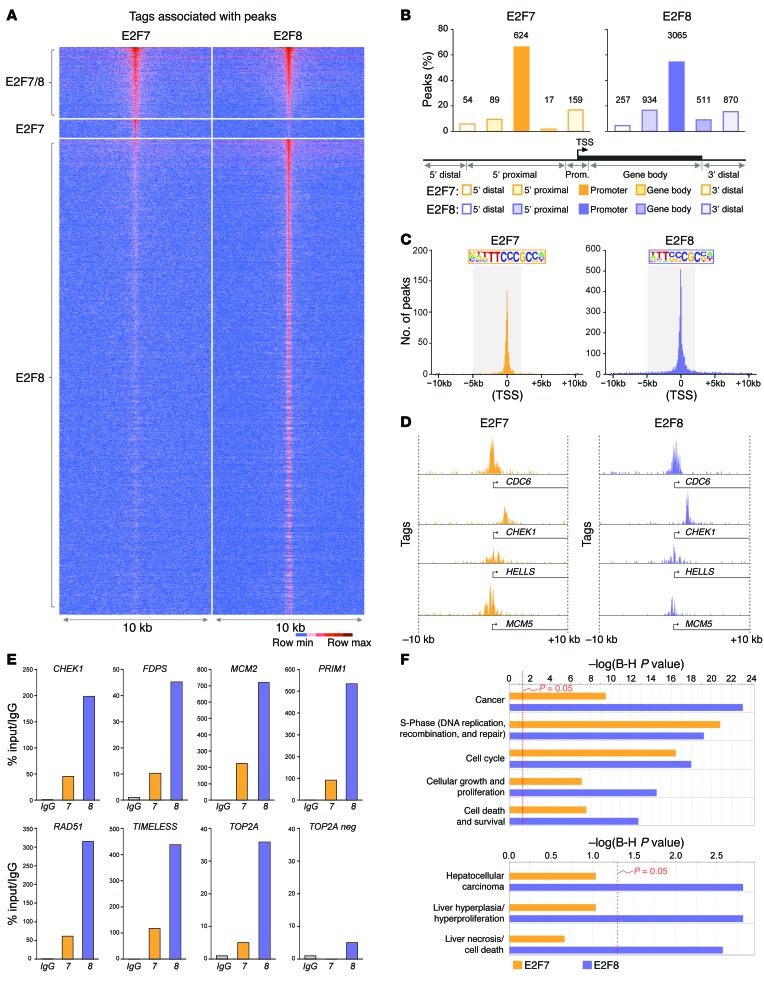
Figure 7. Identification of HCC-relevant E2F targets by ChIP-seq.
(A) Tag-intensity heat map showing the distribution of tags for all E2F7 and E2F8 peaks identified by ChIP-seq. Peaks were centered on E2F8-specific samples except for peaks that were specific to E2F7. (B) Percentage of E2F7- and E2F8-specific peaks in different gene regions. Gene regions were defined by distance from the transcriptional start site (TSS) as follows: 5′ distal (–50 Gb to –50 kb), 5′ proximal (–50 kb to –5 kb), promoter (–5 kb to +2 kb), gene body (+2 kb to end of transcript), 3′ distal (end of transcript to +30 Gb). Number of peaks for each gene region is indicated above bars. (C) Graph depicting the frequency of E2F7 and E2F8 tags relative to the TSS (0). The promoter region (–5 kb to +2 kb from the TSS) is highlighted and the consensus binding sequence at the promoter identified by HOMER is depicted. (D) Examples of E2F7 and E2F8 occupancy at selected promoters. (E) ChIP-qPCR validation using IgG, E2F7, or E2F8 antibodies in HepG2 cells. Selected target promoters are shown (CHEK1, FDPS, MCM2, PRIM1, RAD51, TIMELESS, and TOP2A). A nonpromoter region of TOP2A (TOP2A neg) was used as a negative control. % input values were normalized to IgG. Primers were designed to amplify ChIP-seq–identified peak regions. (F) Gene ontology using ingenuity pathway analysis (IPA) software depicts the estimated contribution of gene functions associated with E2F7- or E2F8-bound promoters. Functional categories related to cell cycle, cancer, and liver disease with the lowest P values are shown. Bars indicate the Benjamini-Hochberg–adjusted (B-H) P value; the threshold of P = 0.05 is shown.

