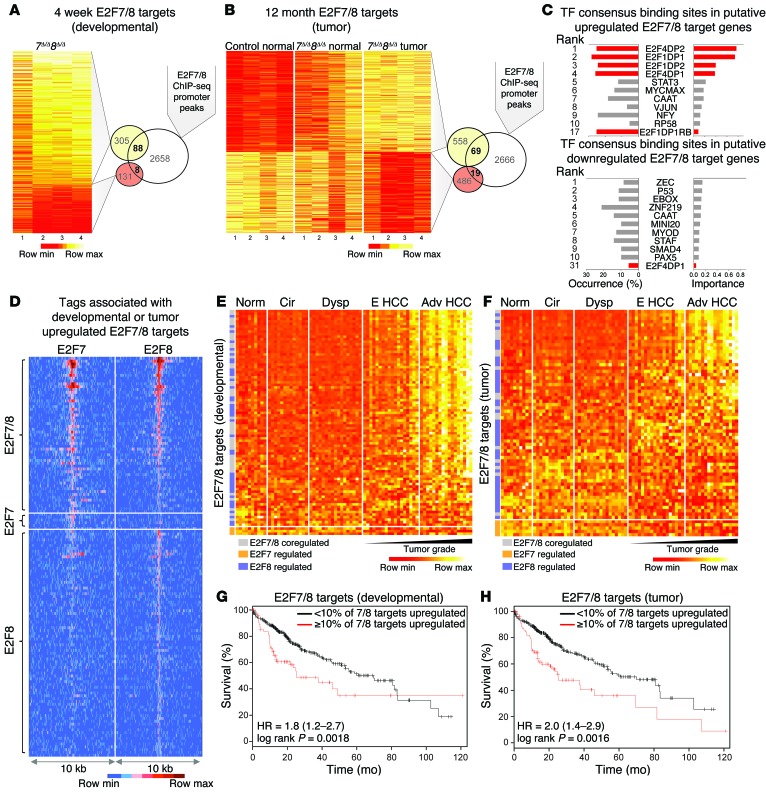
Figure 8. Identification of putative direct targets of E2F7/8 and evaluation of their relevance to human disease.
(A) Fold-change heat map of differentially expressed genes (DEGs) in livers from 4-week-old 7Δ/Δ 8Δ/Δ and control mice measured by Agilent Microarrays. DEGs are defined as having ≥ 1.5-fold change vs. control (P ≤ 0.05). Overlap of DEGs and E2F7/8-occupied promoters (ChIP-seq) represent putative ‘developmental’-associated direct targets. (B) Expression heat map of DEGs in livers or tumors from 12-month-old mice as measured by RNA-seq. DEGs were identified using CuffDiff (≥ 1.5-fold change and FDR < 0.5 between 7Δ/Δ 8Δ/Δ tumor vs. normal control samples). Overlap of DEGs and E2F7/8-occupied promoters represent putative ‘tumor’-associated direct targets. (C) Transcription factor (TF) binding site analysis of putative E2F7/8 targets showing the occurrence and estimated importance of the top 10 TF sites as well as all E2F sites (red). (D) Tag-intensity heat map showing the distribution of tags for all E2F7 and E2F8 promoter peaks identified by ChIP-seq that were associated with DEGs. Peaks were centered on E2F8-specific samples except for peaks that were specific to E2F7. (E) Heat map showing the expression of the 88 developmental-associated E2F7/8 target genes (from A) in normal (Norm) and diseased human patient samples. Cirrhosis (Cir), dysplasia (Dysp), early (E HCC), or advanced HCC (Adv HCC) human livers. (F) Heat map showing the expression of the 69 tumor-associated E2F7/8 target genes (from B) in normal and diseased human patient samples. (G) Kaplan-Meier plots showing % survival of patients that have low (<10%; black line) or high (≥10%; red line) expression of the 88 ‘developmental’-associated target genes. (H) Kaplan-Meier plots showing % survival of patients that have low (<10%; black line) or high (≥10%; red line) expression of the 69 ‘tumor’-associated target genes. HR, hazard ratio (G and H).

