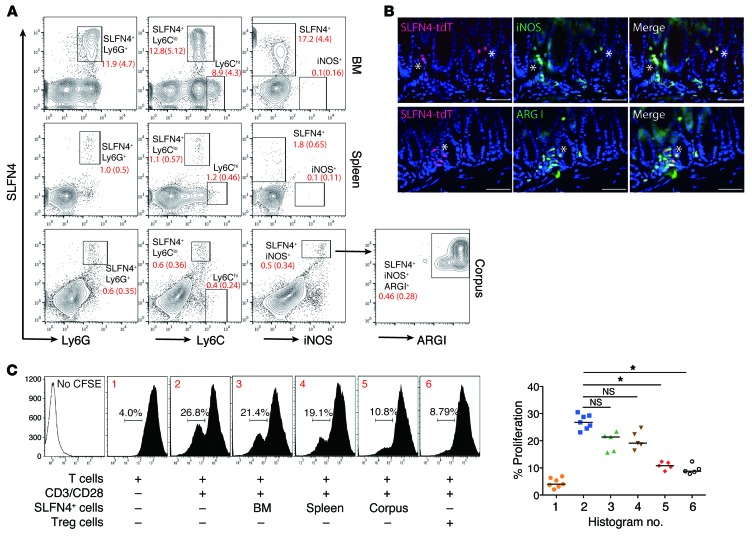
Figure 4. SLFN4+ cells from gastric corpus suppress T cell proliferation.
(A) SLFN4+ cells from bone marrow, spleen, and corpus were analyzed for Ly6G, Ly6C, and iNOS expression. Gated SLFN4+iNOS+ cells from the corpus were further analyzed for arginase I (ARG1). Median percentage (interquartile range) for each gated subpopulation shown in red for n = 4 mice per tissue. (B) Representative images from n = 4 mouse stomachs of SLFN4-tdT+ cells (red) colocalized with ARG1 (green) or iNOS (green). Scale bars: 20 μm. Asterisks indicate colocalization. (C) SLFN4+ cells were sorted from the indicated tissues of 3 pooled 4-month-infected infected pCMV-Shh mice and then cocultured with naive splenic T cells prestained with the CFSE dye. T cell proliferation was initiated with anti-CD3/CD28 microbeads cultured with or without SLFN4+ cells for 72 hours, and CFSE+ T cells were quantified by flow cytometry. The median percentage of proliferating T cells is shown in the representative histograms (nos. 1–6) plotted for n = 5 experiments in the scatter graph. Tregs (CD4+CD25+) from spleen were used as the positive control. Kruskal-Wallis ANOVA with Dunn’s test of multiple comparisons was performed. *P < 0.05.

