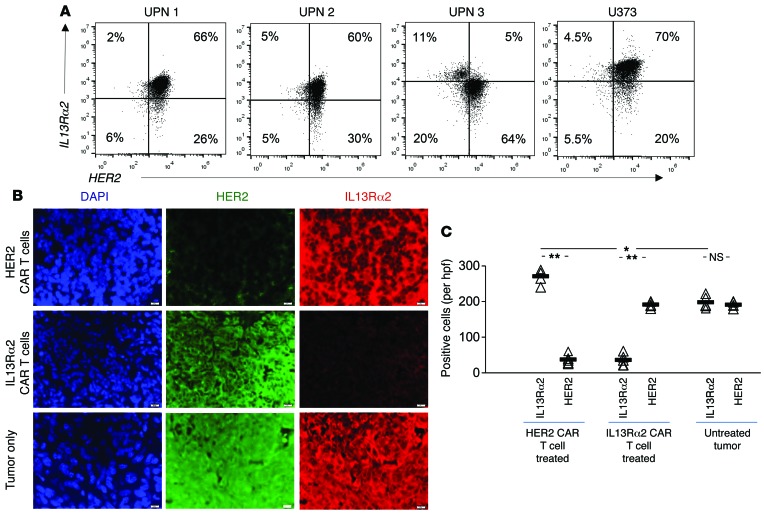
Figure 1. Surface expression of HER2 and IL13Rα2 in primary GBM and the GBM cell line U373 and loss of target antigen in CAR T cell–treated xenografts.
(A) Single-cell suspensions of primary GBM excision samples and U373 were costained for HER2 and IL13Rα2, and more than 100,000 events were analyzed by flow cytometry. Shown are representative dot plots of 3 experiments. UPN, unique patient number. (B) Analysis of U373 xenografts recurring after CAR T cell therapy targeting HER2 and IL13Rα2 using coimmunofluorescence for HER2 and IL13Rα2. Original magnification, ×100. Scale bar – 20 µm. (C) Quantification of staining for HER2 and IL13Rα2 of the data shown in B. Cells were counted in 5 high-power fields (hpfs) per sample. Individual values per hpf and average (bar) are shown. A single-step Tukey’s range test was used for multiple comparisons. *P < 0.05, **P < 0.005.

