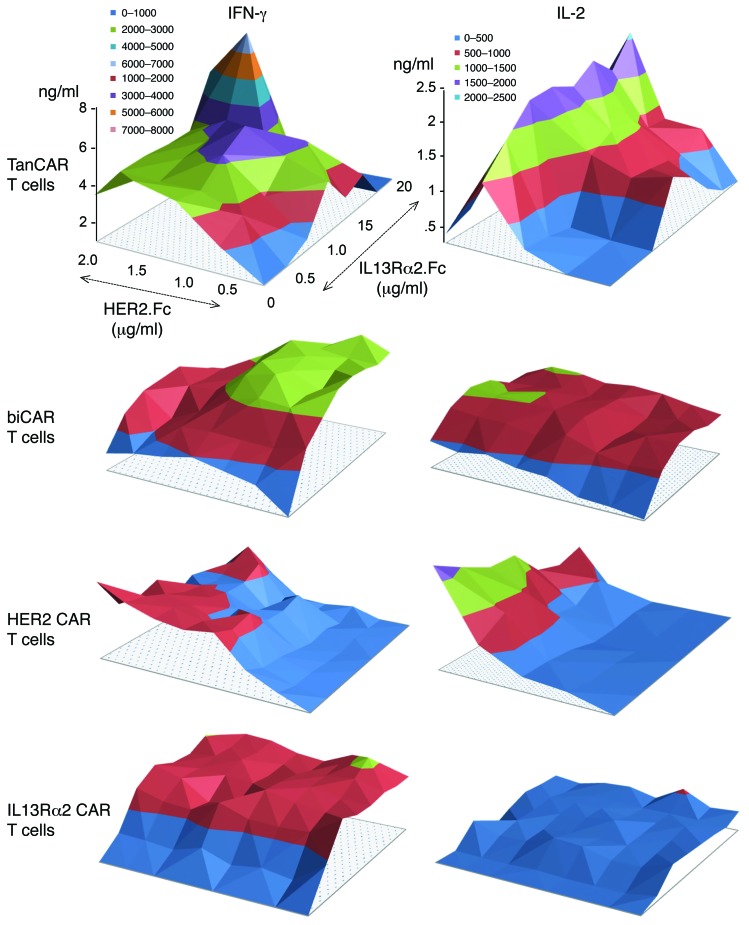
Figure 4. Dynamics of activation of TanCAR T cells upon encounter of a density gradient of HER2 and IL13Rα2.
The activation dynamics of TanCAR T cells, biCAR T cells, HER2 CAR T cells, and IL13Rα2 CAR T cells was studied by seeding of the cells onto polypropylene surface-bound HER2 (range 0–2.0 μg/ml), IL13Rα2 (range 0–20 μg/ml), an irrelevant target (GD2.scFv anti-idiotype, 5 µg/ml), and OKT3 (1 µg/ml). Cytokine analysis (IFN-γ and IL-2) of the culture supernatant using ELISA was performed after 24 hours. Shown are representative data from 3 independent experiments done in triplicates. The titration included 10 antigen concentrations on each axis. Two-tailed t test was used to compare TanCAR cytokine values with those for each single-specificity CAR and biCAR T cells. Significant results are reported in Results. Nonspecific positive control OKT3 induced both IFN-γ (5.5 ng/ml) and IL-2 (2.0 ng/ml) release by TanCAR T cells while there was no cytokine production with GD2 anti-idiotype.

