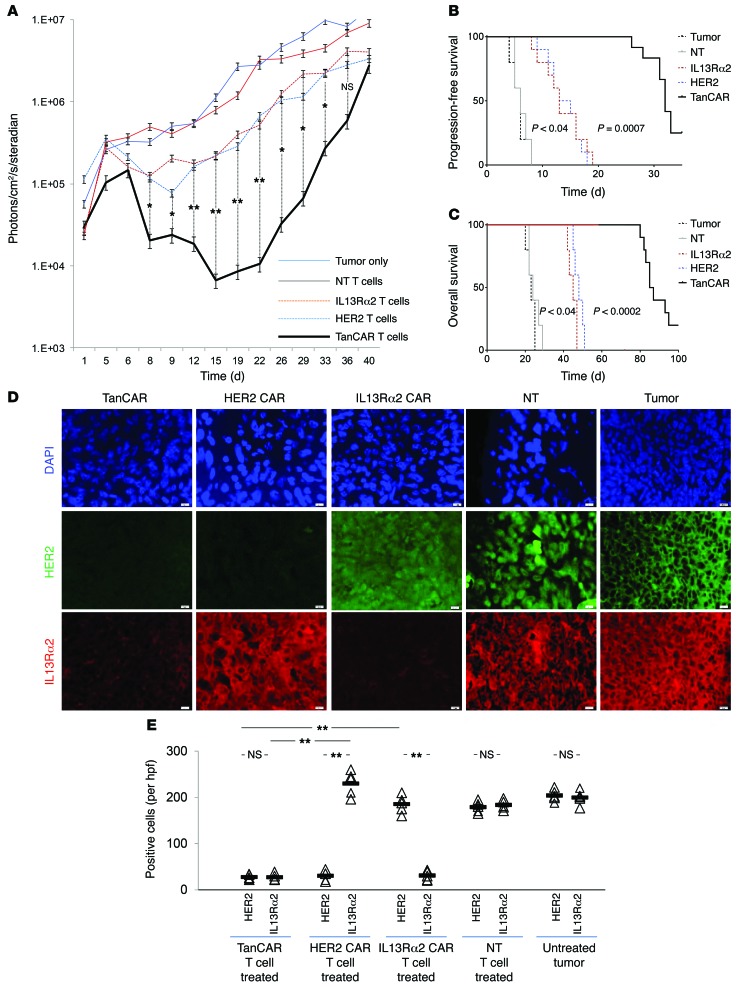
Figure 9. In vivo stress-test experiment evaluating the antitumor activity of CAR T cell products: effect on time to tumor progression, overall survival, and antigen escape.
Tumors were established by stereotactic injection of 2.5 × 10⁵ eGFP.Firefly luciferase–expressing U373 cells into the right frontal cortex of SCID mice. On day 8 after tumor cell injection, mice were treated with an intratumoral injection of 1 × 10⁶ TanCAR T cells (n = 10), HER2 CAR T cells (n = 10), IL13Rα2 CAR T cells (n = 10), or NT T cells (n = 5). The projected T cell/GBM cell ratio was 1:30. Untreated mice (n = 5) were used as controls. (A) Quantitative bioluminescence imaging done at predetermined time points to monitor tumor growth shows the group median, photons/cm2/second/area imaged. See Supplemental Figure 3 for representative animal images. (B) Kaplan-Meier analysis of progression-free survival closed at 40 days after the tumor was established. (C) Kaplan-Meier analysis of overall survival closed at 100 days after the tumor was established. (D) Progressive or recurrent tumors in all 5 groups were analyzed for their antigen expression pattern using coimmunofluorescence for HER2 (green) and IL13α2 (red). DAPI (blue) was used for nuclear staining. Original magnification, ×100. Scale bar – 20 µm. (E) Quantification of staining for HER2 and IL13Rα2 of the data shown in D. Cells were counted in 5–7 hpfs. Individual values per hpf and average are shown. **P < 0.005. A single-step Tukey’s range test was performed.

