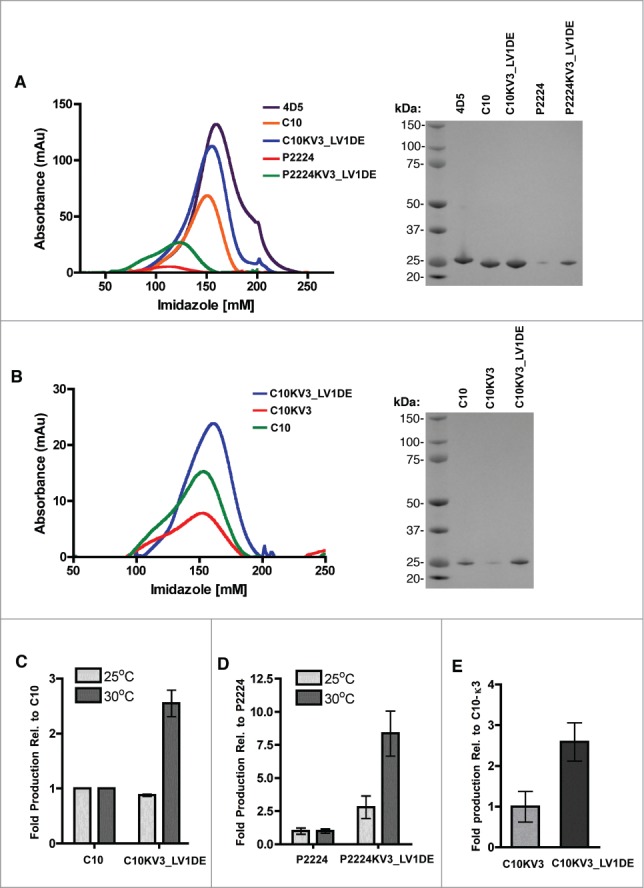
Figure 1.

(A-B) Elution of indicated scFv with increasing imidazole from a HisTrap column after loading with 500 ml (A) or 250 ml (B) culture supernatant from TG1 cells induced to produce protein at 30°C (left panel). SDS-page gel of isolated scFv stained with SimplyBlue (right panel). (C) Fold induction of C10 or C10KV3_LV1DE from TG1 cells at 25 or 30 °C relative to C10 production. (D) Fold induction of P2224 or P2224KV3_LV1DE from TG1 cells at 25 or 30 °C relative to P2224 production. (E) Fold induction of C10KV3 or C10KV3_LV1DE. Bars represent the range of fold production from 2 independent experiments.
