Figure 4.

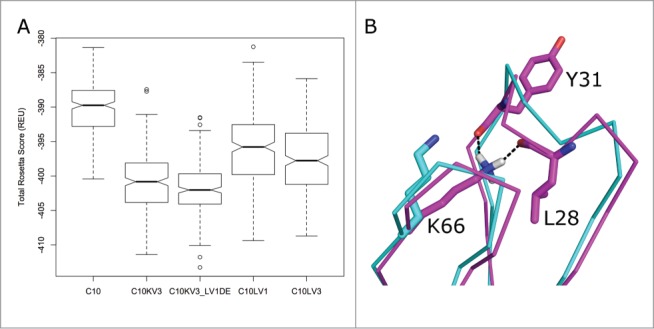
(A) Box-and-whiskers plot of the distributions of Rosetta scores for 250 models (decoys) of refined structures of potential C10 antibody constructs derived by running the dual-space relax protocol of the program Rosetta to models built with RosettaAntibody. The box covers the range from the first (Q1) to the third quartiles (Q3) of the data, and the horizontal line is the median. The whiskers are at Q3+1.5*IQR and Q1–1.5*IQR, where IQR is the interquartile range (Q3-Q1). Outliers beyond the whiskers are marked. (B) Refinement of C10KV3_LV1DE from its initial model (cyan) to a structure with the lowest Rosetta score, which forms a hydrogen bond of the side chain of Lys66 to the backbone carbonyls of the 5th and 8th residues of the CDR L1. This is a common hydrogen bond in λ antibodies when residue 66 is Asn or Lys.
