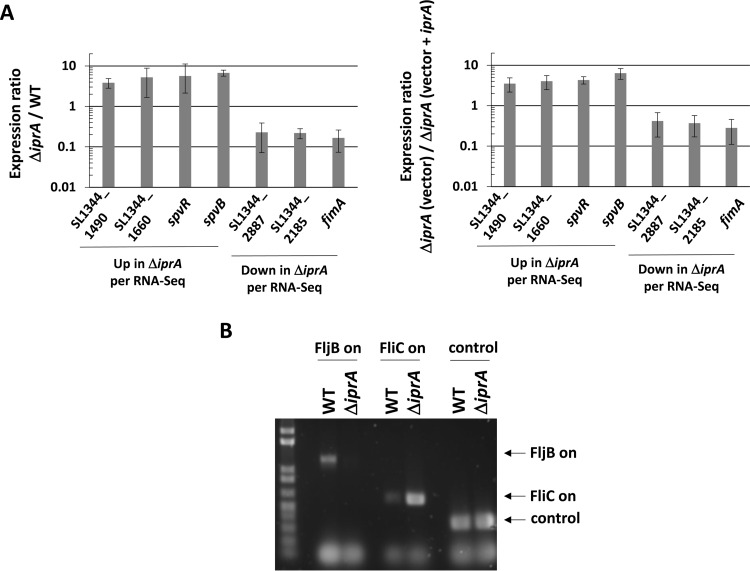
FIG 8.
Confirmation of RNA-Seq results. (A) RT-qPCR analysis was performed using total RNA harvested from S. Typhimurium χ3339 WT and ΔiprA mutant strains (graph on left) and from χ3339 ΔiprA containing either vector or vector plus iprA (graph on right). The qPCR was performed using primers hybridizing to the indicated genes identified from the RNA-Seq results shown in Table 2. The qPCR product levels were normalized to the level of the lpxC gene, and a ratio of each gene level for the ΔiprA mutant to the WT (left) or the ΔiprA mutant (vector) to the ΔiprA mutant (vector plus iprA) (right) was calculated to give a fold difference in expression between the corresponding samples. Differences in expression between the samples for each gene were significant at a P value of <0.05, using a t test to compare WT and ΔiprA mutant samples. (B) DNA analysis of flagellin phase switch in S. Typhimurium χ3339 ΔiprA compared to the WT. PCR products obtained from chromosomal DNA were analyzed to confirm the flagellin phase switch indicated by the RNA-Seq data. Primers that amplify PCR products indicative of either the FljB on (flagellin type 2) or FliC on (flagellin type 1) orientation of the fljA-fljB-hin locus were used to amplify the corresponding DNA fragments from the indicated strains, and the products were run on an agarose gel and stained for fluorescence. In addition, a control product not affected by phase switch was also amplified and run on the gel. The results of the DNA analysis confirm the switch to FliC on in the ΔiprA mutant strain.

