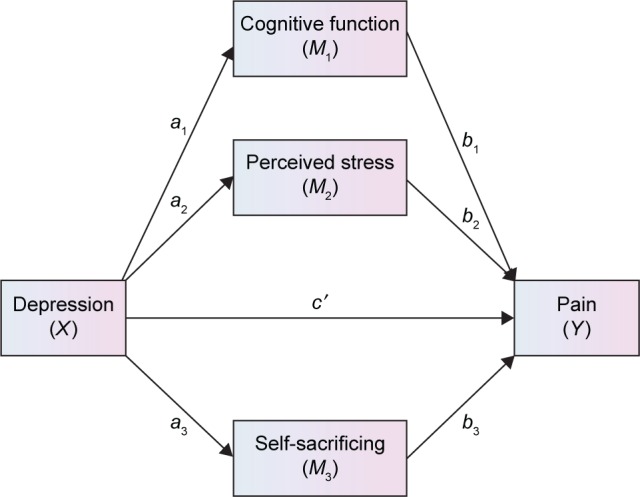
Figure 1.

Path diagram illustrating the direct effects and causal paths linking depression–pain symptoms.
Notes: a1, a2, a3, b1, b2, b3, c′ = path coefficient (unstandardized coefficient). The model fit statistics was chi-square =32.292, df=3, P<0.0001, chi-square/df=10.76; comparative fit index =0.941, root mean square error approximation =0.168, and standardized root mean square residual =0.0350.
Abbreviations: df, degrees of freedom; SMM, serial multiple mediation.
