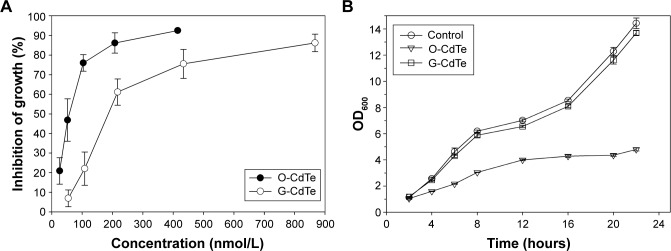
Figure 1.
Toxicity of CdTe QDs of different sizes exposed on Saccharomyces cerevisiae.
Notes: (A) Inhibitory curve of CdTe QDs exposed to S. cerevisiae BY4742 for 16 hours. (For O-CdTe QDs, concentrations were 25.94 nmol/L, 51.88 nmol/L, 103.75 nmol/L, 207.5 nmol/L, and 415 nmol/L. For G-CdTe QDs, concentrations were 54.2 nmol/L, 108.4 nmol/L, 216.8 nmol/L, 433.6 nmol/L, and 867.2 nmol/L.) The inhibitory rate was evaluated using colony-forming units. (B) Effect of 50 nmol/L CdTe QDs on cell growth in S. cerevisiae. The results are expressed as mean ± standard deviation, n≥3.
Abbreviations: CdTe QDs, cadmium telluride quantum dots; G-CdTe, green-emitting CdTe; O-CdTe, orange-emitting CdTe; OD, optical density.

