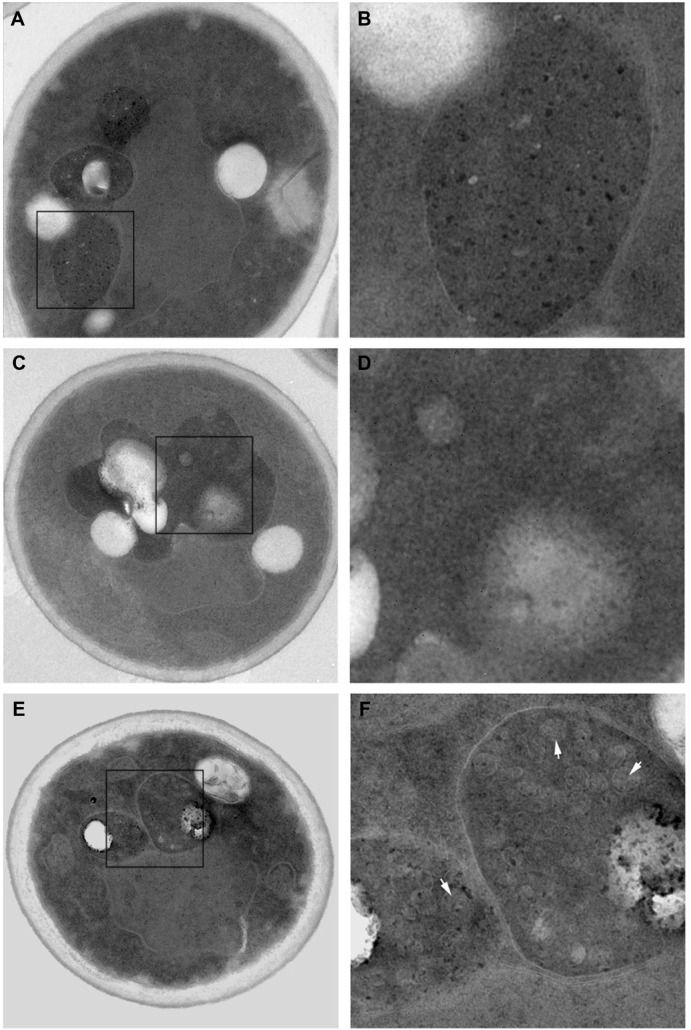
Figure 2.
Transmission electron microscopy images of yeast cells (left) and their vacuoles (right), enlarged from left-hand box at 16 hours.
Notes: The control cells (A) and (B), G-CdTe QDs treated cells (C) and (D) and O-CdTe QDs treated cells (E) and (F) were observed by transmission electron microscope (×7,800 magnification). White arrows: autophagic bodies.
Abbreviations: CdTe QDs, cadmium telluride quantum dots; G-CdTe, green-emitting CdTe; O-CdTe, orange-emitting CdTe.

