
Figure 8.
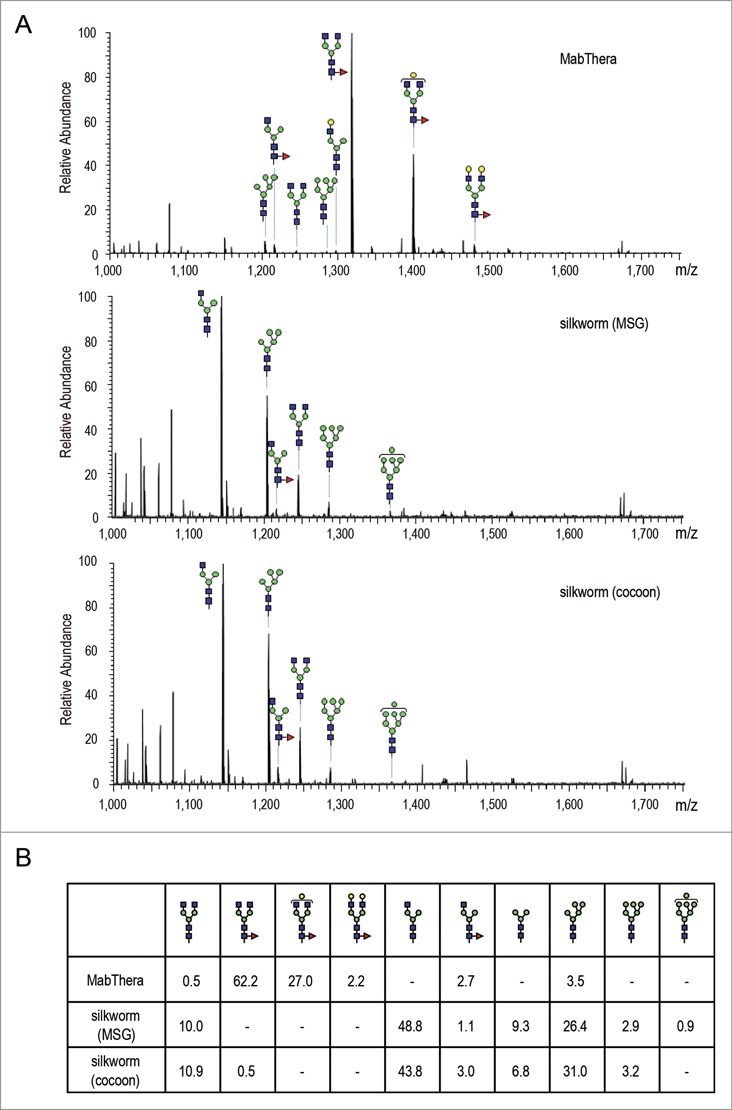
Fc glycosylation analysis of anti-CD20 mAbs. (A) Comparison of mass spectra acquired at the elution point of the glycopeptides of EEQYNSTYR, corresponding to 293–301 amino acids (EU numbering) in the heavy chain of anti-CD20 mAbs. (B) Percentage distributions of glycoforms were calculated by the relative peak area average values. Symbols: blue square, N-acetylglucosamine; green circle, mannose; yellow circle, galactose; red triangle, fucose.