
Figure 5.
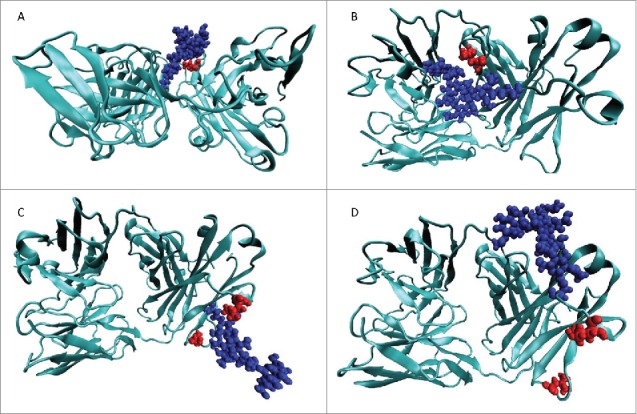
Representative structures from the MD for the 4 MD simulations of the hyperglycosylated variants. In all cases, the left of the image is the CDR and the right side is the hinge region. The protein structure is shown in teal, the glycosylation moiety is shown in blue, and the residues to be masked by the glycosylation motif are shown in red. (A) L118N hyperglycosylated variant designed to cover L180. (B) Q160N hyperglycosylated variant designed to cover L180. (C) E195N hyperglycosylated variant designed to cover L154 and L201. (D) Q160S hyperglycosylated variant designed to cover L154 and L201.