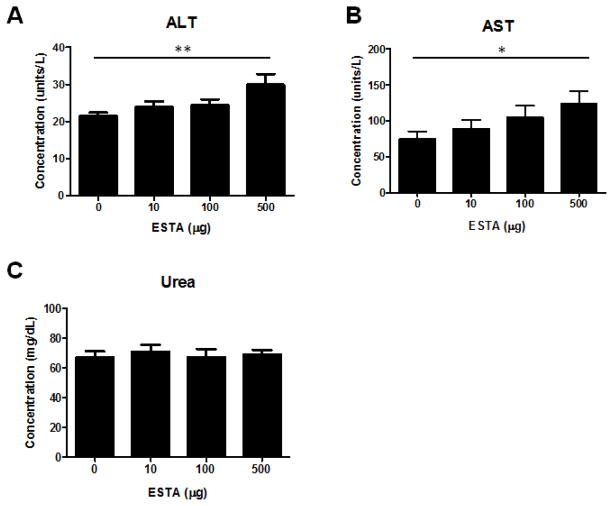
Figure 1.
Levels of plasma ALT (A), AST (B), and urea (C) in mice that were administered 10, 100, or 500 μg of ESTA intravenously, twice a week for 4 weeks. The plasma was isolated from whole blood collected 2 days after the last injection. The data represent Mean ± SEM (n=7–9). Statistical significance was determined by linear regression models (*, p<0.05; **, p<0.01).

