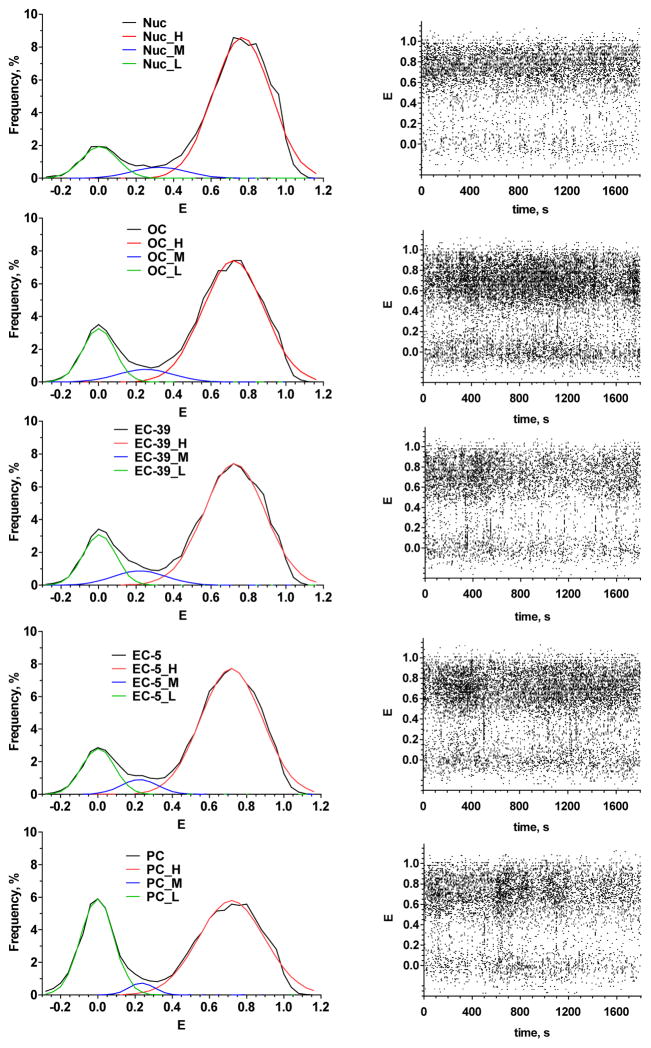
Figure 5. spFRET analysis of nucleosomes and their complexes with stalled RNAP.
Left column - frequency histograms of FRET efficiency (E) for nucleosomes (Nuc), open complex (OC), elongation complexes -39 (EC-39), -5 (EC-5) and post chase state (PC). Colored plots are the result of histogram deconvolution into three states: high FRET (H), middle FRET (M) and low FRET (L). Right column - time courses of FRET for nucleosomes and stalled complexes shown on the left. Dots represent E values measured for each single nucleosome (stalled complex) diffused through the focal volume in different moments of an observation period. High structural stability is an obvious property of the nucleosomes and stalled complexes.

