Fig. 8.

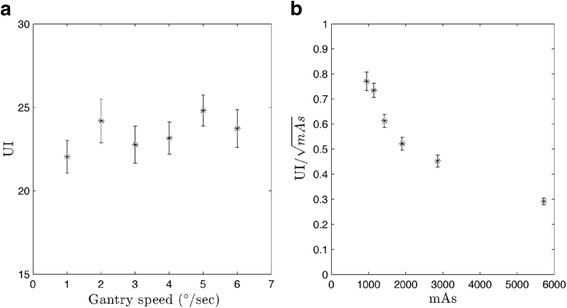
UI for CBCT-ave plotted against a gantry speed and b normalized to mAs. Values were calculated over ten individual slices and then averaged. All error bars represent standard error

UI for CBCT-ave plotted against a gantry speed and b normalized to mAs. Values were calculated over ten individual slices and then averaged. All error bars represent standard error