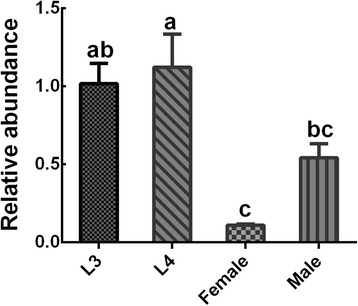
Fig. 4.

Transcriptional profile of Hc-daf-22 at different developmental stages of H. contortus and genders. Data shown are mean values (± standard error of the mean, SEM) derived from three replicates in repeat experiments. All gene expression levels were normalized to those of the β-tublin gene. P-values are calculated by Dunnett’s test. There were significant differences between stages indicated by different letters (a, b, c) (P < 0.05)
