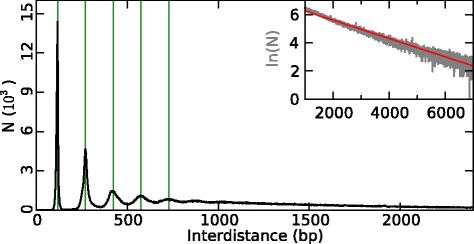
Fig. 2.

Histogram of (1,581,005) border to border inter-distances between successive NIEBs. The inset corresponds to a log-lin representation of the tail of this histogram, which puts into light a Poisson-like exponential behavior with a mean interdistance bp (red straight line). The green vertical lines mark interdistances d=117+153 k (bp), k=0,1,2,3 and 4
