
Fig. 5.
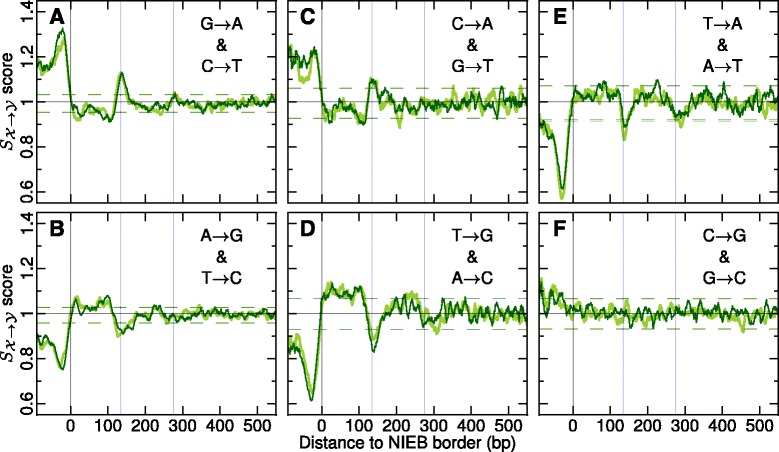
Evidence of selection in and around the 1,581,256 NIEBs. Ratios of background corrected inter- and intraspecies divergence rates plotted against the position from the closest NIEB border (negative distances correspond to loci inside the NIEBs). The pannels correspond to the substitution rates: (a) G → A and C → T; (b) A → G and T → C; (c) C → A and G → T; (d) T → G and A → C; (e) T → A and A → T; (f) C → G and G → C. In each panel the first (resp. second) substitution is represented in dark green (resp. light green). Curves were smoothed over 10 bp windows. The vertical blue lines have the same meaning as in Fig. 1 a’–c’. The horizontal dark green (resp. light green) dashed lines, mark the 95 % confidence intervals for ratios under the hypothesis of neutral evolution (Methods); the probability for to be above (resp. below) these limits is 0.025