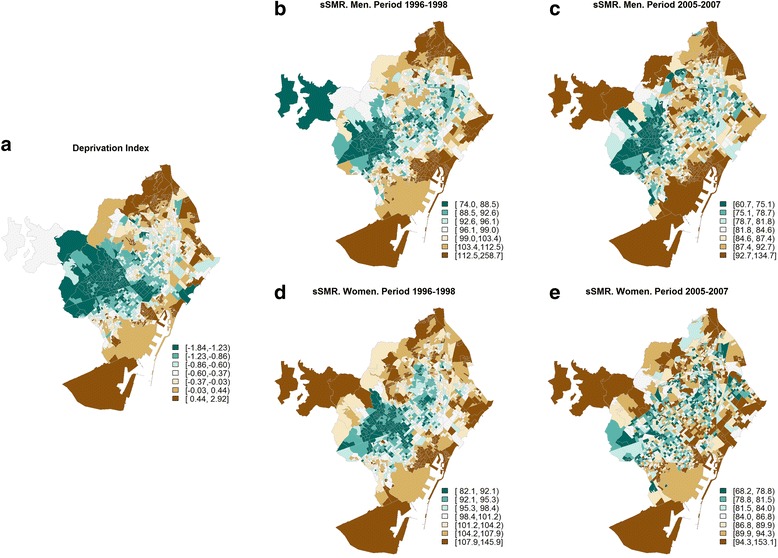
Fig. 1.

Distribution of deprivation index (a) and of the smoothed Standardised Mortality Ratios (sSMR) (b-e) for all-cause mortality, by period (1996–1998 and 2005–2007) and by sex in the city of Barcelona. Green areas represent less socioeconomic deprivation and lower sSMR values. Brown areas represent greater socioeconomic deprivation and higher sSMR values
