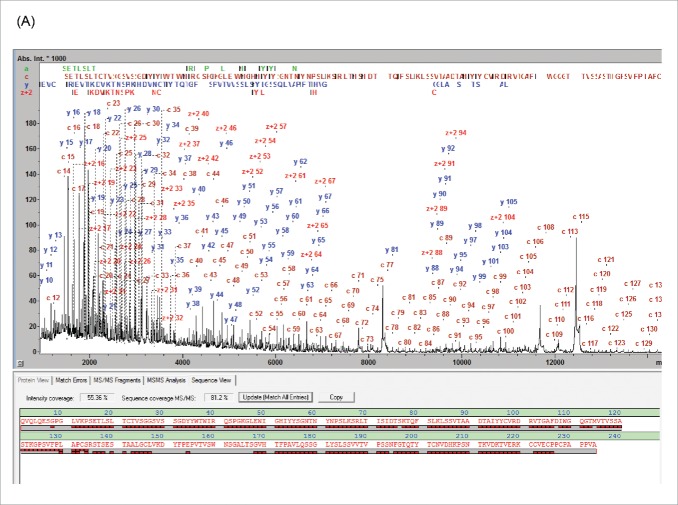
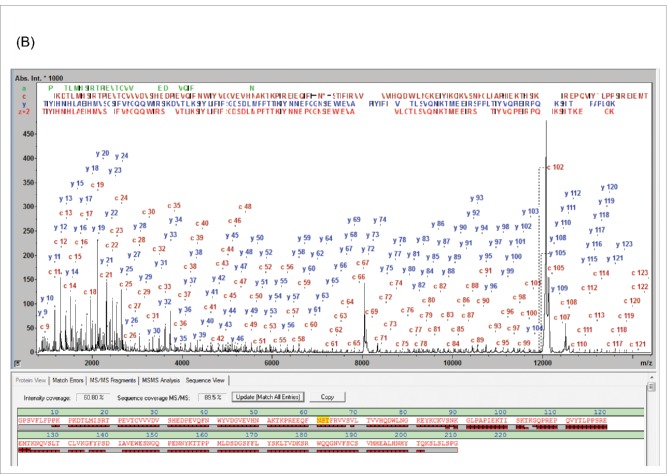
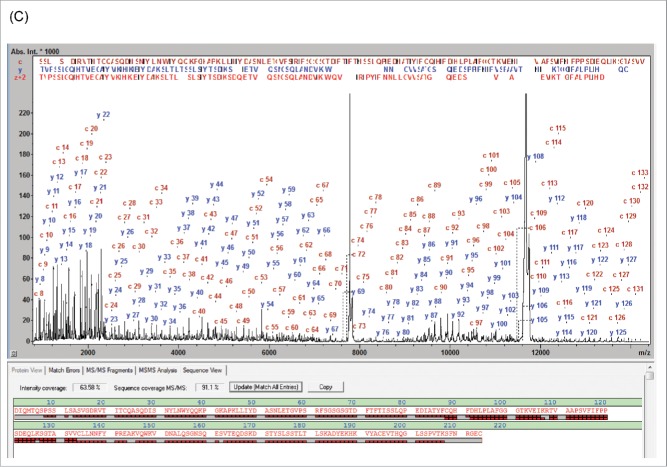
Figure 1.
MD MALDI-ISD spectra of panitumumab subunits from the separation shown in Fig. S1: (A) Fd, (B) Fc/2 IgZERO treated, C-term des-Lys, and (C) LC, The N-terminal c-ions and the C-terminal y- and z+2-ions are assigned in the spectra. In each sequence panel the fragment ion matches are visualized as red bricks; the top and bottom rows representing N- and C-terminal fragment ions, respectively. Mass errors of fragments are < 0.1 Da up to 6 kDa and < 0.5 Da up to approx. 15 kDa.
Figure 1.
Continued
Figure 1.
Continued


