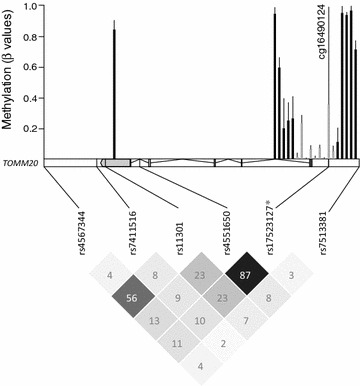
Fig. 1.

Methylation profile and linkage disequilibrium (LD) map within the TOMM20 locus. The upper part of the figure shows mean methylation levels of the 20 CpG (CpG island—grey bars; upstream and downstream regions—black bars) identified within TOMM20 locus in visceral adipose tissue samples (n = 48). Methylation levels shown as average β values ranging from 0 (unmethylated) to 1 (completely methylated). The lower part shows the LD map of genotyped and imputed SNPs within TOMM20 locus in the study population (n = 1720), considering the CEU panel (Utah residents with Northern and Western European ancestry) of the latest release of the 1000 Genomes Project (Phase 3). LD r2 values (%) are shown in boxes. The imputed SNP is marked with an asterisk
