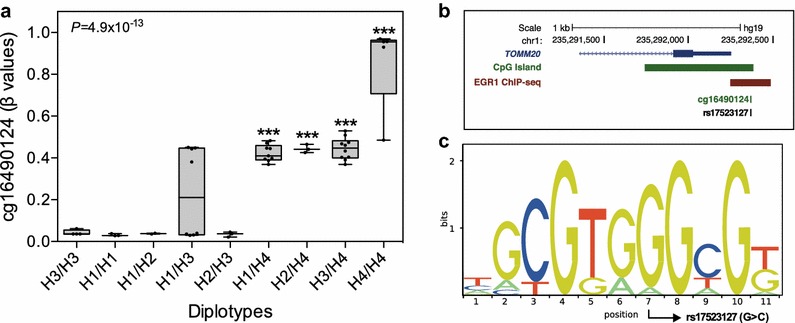
Fig. 3.

Mean methylation levels of cg10738648 for each diplotype and a schematic representation of Erg1-binding sites. a Mean degree of cg16490124 methylation levels for diplotypes in visceral adipose tissue samples. CpG methylation levels are shown as average β values ranging from 0 (unmethylated) to 1 (completely methylated). Values presented (mean ±SE) and P values were obtained by general linear models (type III sum of squares) adjusted for the effect of age, sex and BMI (n = 48). Asterisks represent significant differences vs. H3/H3 (reference diplotype). ***P ≤ 0.0001. b Schematic representation of the TOMM20 promoter region showing Erg1-binding sites (horizontal red bar), CpG island (horizontal green bar), cg16490124 and rs175231127, obtained from ENCODE data in the UCSC genome browser. c Sequence logo is the graphical representation of the Egr1 position-specific scoring matrix (PSSM) identified by TRAP and obtained from the Transfac database (ID: M00243). Sequence logo shows the base preference, sized and sorted relative to their occurrence in the PSSM. The location of the CpG-SNP rs175231127 (G > C) within the Egr1-binding site is marked with an arrow
