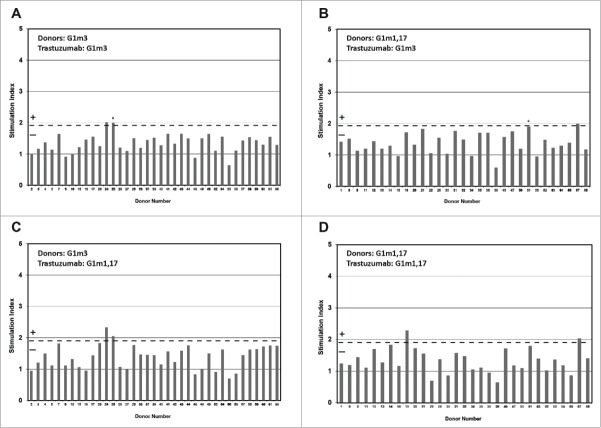
Figure 2.
Healthy donor T-cell proliferation to IgG1 G1m3-trastuzumab and G1m1,17-trastuzumab. T-cell proliferation was measured from bulk cultures of PBMC on days 5, 6, 7 and 8. Figure shows the maximum stimulation index over the 4 day period. The threshold for positive T-cell proliferation (SI ≥ 1.90, p < 0.05) is indicated by red dotted line. Borderline responses (SI = 1.90-1.95, p < 0.05) are indicated (*). Donors expressing homozygous G1m3 (a and c) and G1m1,17 (b and d) were tested against G1m3-trastuzumab (a and b) and G1m1,17-trastuzumab (c and d)

