
Figure 1.
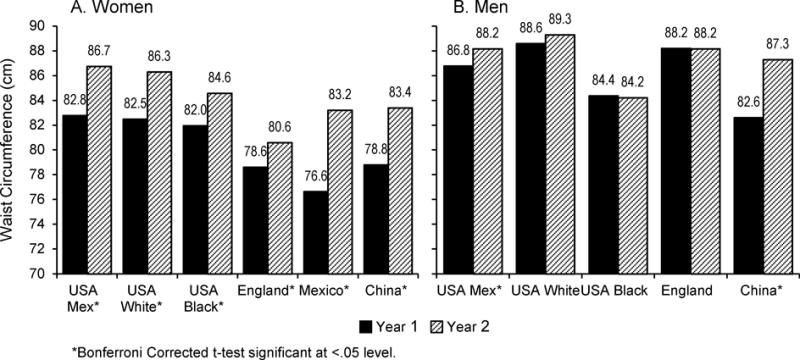
Predicted mean WC (cm) for BMI=25 kg/m2 in Year 2 compared to Year 1 for women and men aged 20–29 years in the US (by race/ethnicity), England, Mexico, and China. A) Women; B) Men. Data are derived from: China: The China Health and Nutrition Survey (CHNS, 1993 and 2011)24; England: The Health Survey for England (HSE), 1992–93 and 2008–920; United States: The National Health and Nutrition Examination Survey (NHANES III:1988–94 and the combined NHANES 2007–8 plus 2009–10)19; Mexico: The Mexican Nutrition Survey 1999 (MSN 1999) and the Mexican National Health and Nutrition Survey 2012 (NHNS 2012)25, 26. Panels A and B show results from country- and sex-stratified (in the US, also race/ethnicity-stratified) multivariable linear regression models that include: age (categorized: 20–29, 30–39 40–49 years), BMI, BMI-squared, survey year, age*survey year, BMI*survey year, BMI-squared*survey year. For brevity, only results for age group 20–29 years shown in figure.