
Figure 2.
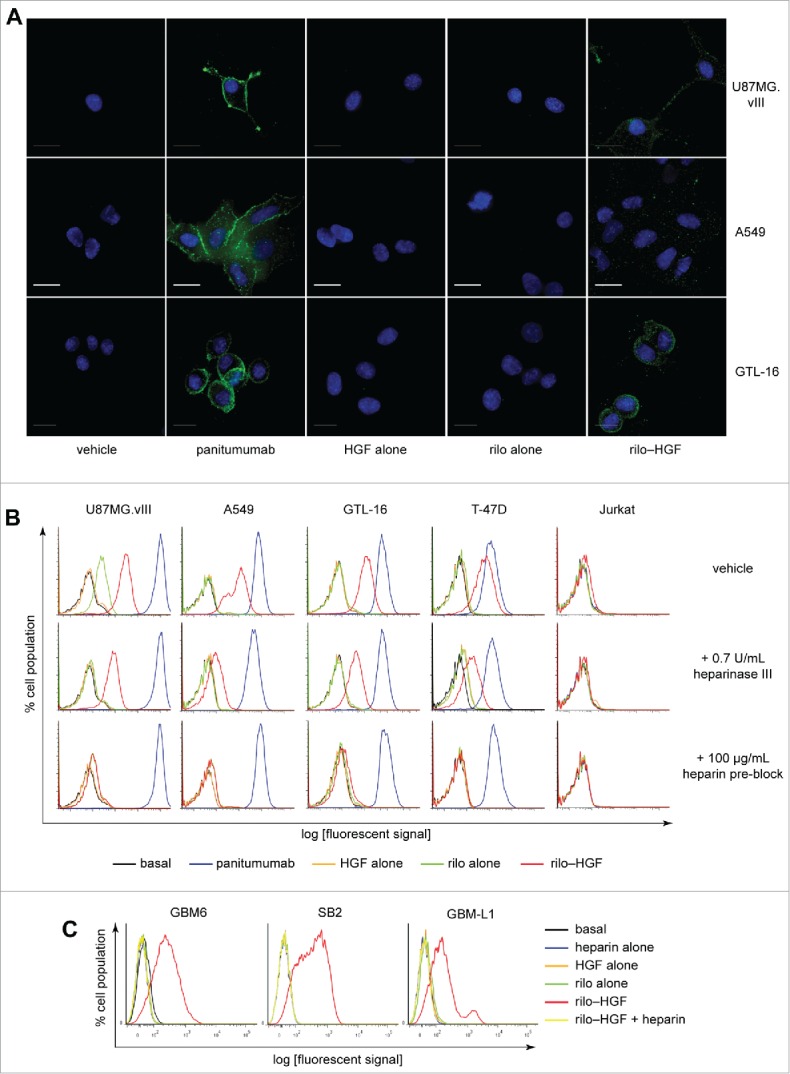
rilo–HGF engages with the cell surface in multiple different cell lines. (A) Immunofluorescence demonstrating engagement of 55:1 rilo–HGF (green) with the surface of U87MG.vIII, A549 and GTL-16 cells. Nuclei were stained with DAPI (blue). Scale bar, 50 μm. Panitumumab was included as a positive control for human IgG detection. (B, C) Flow cytometry tests demonstrating cell-surface engagement of rilo–HGF under differing conditions with conventional cell lines derived from several distinct cancers (B) or primary gliomaspheres derived from patient tissue (C). Treatment concentrations for all tests were 10 µg/mL rilotumumab, 10 µg/mL panitumumab, 100 ng/mL HGF, 100 µg/mL heparin or 55:1 rilo–HGF.